Economic News

Economic News

Scary Picture?

Some macro series. One observation does not make a trend – but still… Figure 1: Monthly GDP (black), private nonfarm payroll employment-ADP (blue), civilian employment w/smoothed population controls (light blue), aggregate hours (light green), consumption (tan), personal income ex-transfers (pink), real retail sales (purple), all in logs 2025M01=0. Real retail sales is 3 month centered moving average of retail sales, divided by chained CPI. Source: S&P Global, ADP-Stanford, BLS, BEA, Census, and author’s calculations. Note that NBER’s Business Cycle Dating Committee places primary emphasis on employment and income. Series that continue to rise include the Philadelphia Fed’s coincident index. For a more complete tabulation of series, see this post.  

Economic News

West Coast Port Traffic Down

Or at least Long Beach and LA: Figure 1: Inbound loaded TEU’s at Long Beach and LA ports, n.s.a. (black, left scale), year-on-year growth (light blue, right scale). NBER defined peak-to-trough recession dates shaded gray. Source: Ports of Long Beach, LA, NBER and author’s calculations. Inbound traffic is down 3.5% y/y, and down 32.7% q/q AR.  

Economic News

Nowcasts of GDP and “Core GDP”

As of today, GDP nowcasts split, but final sales to private domestic purchasers (coined “Core GDP” by Furman) consensus is deceleration. Figure 1: GDP, 3rd release (bold black), WSJ July survey mean (tan), GDPNow (light blue square), Goldman Sachs (inverted red triangle), NY Fed (open green triangle), St. Louis (pink *). All nowcasts are as of 7/25. Source: BEA, WSJ survey, Atlanta Fed, NY Fed, St. Louis Fed, Goldman Sachs and author’s calculations. At 5 days to the 2025Q2 advance release (on July 30), the Atlanta Fed’s GDPNow has been about as accurate as the Bloomberg consensus, at least in pre-pandemic days. Here’s DeutscheBank’s 2019 comparison. Source: Luzzetti, et al. “Tracking the GDP trackers,” Deutsche Bank US Economic Perspectives, 24 July 2019. The NY Fed nowcast has been substantially revamped, so the MAE numbers shown above are no longer relevant. Kalshi betting is on 2.5% as of today, close to GDPNow’s 2.4% q/q AR. As is by now well known, the GDP measure has been distorted by tariff front-running combined with difficulties in accurately measuring inventory accumulation. Hence, it makes sense to look to domestic private demand for all goods and services. This is proxied by final sales to private domestic purchasers, aka “Core GDP”. Figure 2: Final sales to private domestic purchasers, 3rd release (bold black), GDPNow (light blue square), Goldman Sachs (inverted red triangle). All nowcasts are as of 7/25. Source: BEA, Atlanta Fed, Goldman Sachs and author’s calculations. Since the series are drawn on a log scale, the flattening slope is equivalent to decreasing growth rates. Both predictions are for 0.9% q/q AR growth, down from 1.9% in Q1, and 2.9% in 2024Q4.    

Economic News

Signs of a Slowing Russian Economy: CBR Drops Rate 200 bp

Three weeks ago, Bofit remarks “Concerns emerge over Russia’s slowing growth”: Rosstat this week affirmed its preliminary first-quarter GDP growth estimate of 1.4 % y-o-y, bolstering the view that a substantial slowing of Russia’s economic growth is underway. 1Q25 GDP shrank from the previous quarter by 0.6 % – the first on-quarter decline in GDP since spring 2022 following the invasion of Ukraine. Annual GDP growth was still supported by war-related manufacturing industries and services. In contrast, mining and quarrying production, for example, contracted clearly in January-March, and the volume of wholesale and retail sales also decreased slightly. … Russia’s GDP forecasts have generally been lowered in recent months due to the worsening economic imbalances and the fall in oil prices. The World Bank’s forecast published in June expects GDP growth of 1.4% this year and 1.2% next year. Consensus Economics’ June report predicts GDP growth of 1.4% this year and 1.3% next year. And so in some sense not surprising that the Central Bank of Russia drops the interest rate, today: It’s not clear to me that this will do anything much except accelerate inflation; that’s because of the reasoning in the Bofit piece as well as Hilgenstock and Ribakova (PIIE): By the end of 2024 and in early 2025, signs of economic deceleration had become evident. Even the military-industrial sector began to stagnate. The economy had butted up against its supply-side constraints and the Bank of Russia was focused on reining in inflation. In the first quarter of 2025, annual growth slowed to an estimated 1.4 percent year-on-year (from 4.5 percent in the last quarter of 2024). This actually means a 0.6 percent contraction of activity compared to the previous quarter—the first quarterly contraction since the second quarter of 2022 (figure 1). Monetary policy can’t do much if the supply side is constrained. Maybe there’ll be a respite in commodity (oil) prices. It could be that Trump relaxes sanctions. However, even Brent prices remain low so it’s not clear that this would save the Russian economy. One implication: Now is not a time to relent in terms of pressuring the Russian economy. Moscow’s ability to continue to wage war is being more and more constrained, even as resources continue to be directed to that endeavor.        

Economic News

What Fed Funds Rate Does Trump Want?

Compared to Taylor rule, according the to the Atlanta Fed Taylor rule utility. Figure 1: Fed funds implied by Taylor rule. 3 ppts below current Fed funds rate is 1.33%, marked by x. This graph highlights how much Mr. Trump’s views on monetary policy differs from those still in touch with reality.  

Economic News

(Fed) Credibility Lost? Bordo-Siklos 5 Year

We see reversion in the Bordo-Siklos measure of inflation credibility back toward pre-Trump 2.0 levels. However, we’ll see if this is recovery is durable in the wake of Trump’s attacks on Fed independence (including a historic non-ceremonial visit by a sitting President). Figure 1: Bordo-Siklos measure of Fed inflation credibility (blue). Calculation assumes CPI target consistent with PCE target is 2.45%. July observation is preliminary. Light orange shading denotes Trump administrations. Orange dashed line at “Liberation Day”. NBER defined peak-to-trough recession dates shaded gray. Source: BLS, NBER, author’s calculations. 

Economic News

Guest Contribution: “Global shocks, institutional development, and trade restrictions: What can we learn from crises and recoveries between 1990 and 2022?”

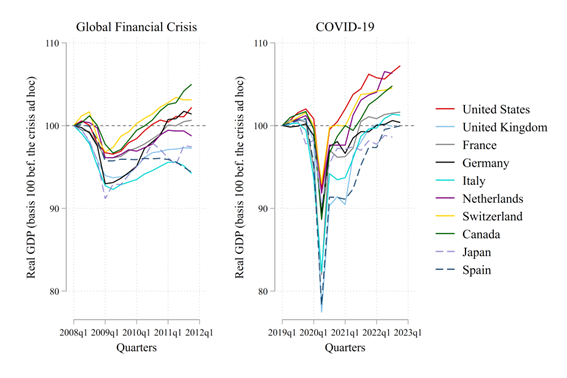
Today, we are pleased to present a guest contribution written by Jamel Saadaoui (Université Paris 8-Vincennes). This post is based on the paper of the same title (Aizenman, Ito, Park, Saadaoui, and Uddin, 2025).  1. Introduction During the past 20 years, the world economy suffered two major crises: the global financial crisis of 2008-2009 (the GFC hereafter) and the pandemic crisis (the COVID-19 hereafter) of 2019-2020. A common denominator between the two crises is that both impacted the entire world rather than just one region or one group of countries. In Aizenman et al. (2025), we analyze the patterns of recessions and recoveries of 101 advanced and developing economies, identifying the turning points of recessions and expansions between 1990 and 2022, and perform cross-country analysis of domestic and external drivers of economic recovery. In addition to the standard independent variables, we include institutional development, political stability, the extent of democracy, and trade restrictions indexes and explore their roles in explaining recessions and recovery patterns. Two distinct models of economic recessions can be identified. The first, a Hamiltonian recession, is derived from the pioneering work of James Hamilton (Hamilton, 1989) and foresees recessions that prevent economies from returning to their pre-crisis growth trajectory (see Cerra and Saxena (2008)). This type of recession typically leads to a permanent reduction in an economy’s productive capacity and income level. The second model of recession, conceptualized in modern economic discourse by Milton Friedman (Friedman, 1964, 1993), assumes dynamics known as a Friedman-like recession, which is akin to the response of a stretched guitar string. The further the economy is pushed downward, the more forcefully it rebounds.[1] Productive capacity remains largely intact, and the economy does not suffer a permanent loss of income. The supply side remains resilient, in contrast to the Hamiltonian scenario. Countercyclical monetary and fiscal policies may yield very different results in the two models. To identify economic recessions and recovery, we use the Bry-Boschan (B.B.) algorithm. It automates the cycle-dating procedure in line with the National Bureau of Economic Research (NBER) tradition (Bry and Boschan, 1971). Using the B.B. algorithm, we identify 419 recessions in our sample of 101 countries over the period 1990-2022. We found that 59 recoveries occurred in 2009 (i.e., the GFC) and 94 occurred in 2020 (i.e., the COVID-19 crisis). Notably, the number of recessions during the COVID-19 crisis is twice as many as during the GFC, illustrating the significant impact of the pandemic. Although many emerging market economies (EME) experienced financial crises in the late 1990s and early 2000s, the number of recessions was not as frequent, suggesting that the crises in emerging market economies were regionally contained. Figure 1. Comparing Two Recoveries: GFC Versus COVID-19 in Industrialized Economies.[2] In Figure 1, GFC seems to have had a longer-lasting impact on this group, with recovery mostly sluggish. For instance, Switzerland and Canada managed to reach their pre-crisis real output level only in the first quarter of 2010. Meanwhile, the peripheral euro-area countries were subsequently hit hard by the euro crisis. On the other hand, the impact of COVID-19 was much bigger than that of the GFC, with Japan and Spain suffering real GDP losses of 20 percent. However, the recovery was also much faster and stronger than during the GFC. The downturn lasted less than two quarters in most cases. For instance, the US and Switzerland managed to recover their pre-crisis real output in the second quarter of 2020. Once again, the recovery was more sluggish for peripheral euro-area countries. In Figure 2, we compare the two recoveries for a selective group of EMEs. In the left panels, we observe that recoveries after the GFC were faster and stronger in EMEs than in IDCs. Since the GFC primarily affected the financial systems and real economies of financially well-developed advanced economies. In the left panel of Figure 2, we observe that the post-COVID-19 recovery pattern was similar for the broader group of EMEs and IDCs. Figure 2. Comparing Two Recoveries: GFC versus COVID-19 in Emerging Market Economies.   2. Regression Results We investigate the determinants of the variables related to recessions and recovery. In addition to the macroeconomic variables identified as important, we include institutional variables based on the principal components (PC) of political risk ratings in the ICRG database. First, we use panel logit models to estimate the probability of an economy entering a recession.[3] Then, given the heterogeneity of our sample economies, we obtain insightful results when we apply a panel logit estimation augmented with interaction terms. Higher levels of holding IR would reduce the probability of a recession, but only for low levels of trade restrictions (i.e., freer trade). This result echoes in the finding of Aizenman, et al. (VoxEU 2023)  about the complementarity between the holding of IR and capital account restrictions in the context of terms-of-trade shocks. The buffer effect of IR is only observed when the economy is sufficiently open to trade. When the level of trade restriction is too high, the holding of IR is no longer associated with a reduction of the probability of a recession. When trade restrictions are too high, the buffer effect of macroeconomic variables disappears. Next, we examine whether Hamilton’s or Friedman’s model better depicts the recovery path in the aftermath of a recession. The results suggest that in a stable political environment (Figure 3), recessions during which the GDP decreases by an additional 1 percent induce a stronger output recovery of around 0.9 percent after 4 quarters. The length of the recession has no significant effects on the extent of the recovery 4 quarters later.[4] When the number of trade restrictions is very low (Figure 4), recessions during which the GDP decreases by an additional 1 percent induce a stronger output recovery of around 0.8 percent after 4 quarters. The length of the recession has no significant effects on the extent of the recovery 4 quarters later. Figure 3. Deeper recessions, stronger recoveries? Not always due to political instability. Figure 4. Deeper recessions, stronger recoveries? Not always due

Economic News

How Resilient Is the Consumer, Really?

I see this constantly remarked upon, so I wanted to check the data. Figure 1: Consumption, 2017$ (bold black, left scale), Services Consumption, 2017$ (tan, left scale), Retail Sales in 1999M12$ (light blue, left scale), all in logs 2025M04=0; U.Mich. Survey of Consumers expectations (red, right scale). Source: BEA, Census, BLS, U.Michigan Survey of Consumers, and author’s calculations. Whether the consumer is surprisingly resilient depends on what one expected consumption to do given determinants (income, expected income, costs, uncertainty, wealth…). Without a full fledged model, I can still observe that real consumption’s trend has changed to flat. Since this series includes durables consumption expenditures — which has been distorted due to front-running tariffs — one can look to services consumption. This variable should be more sensitive to permanent income (in the Hall (1979) sense). Here, the break in trend is apparent as well. Finally, real retail sales have declined since March. With a June observation, we have a more recent reading on the consumer’s behavior — and it’s not indicating a strong resurgence. Consumer expectations have improved, and one would expect something of a rebound in consumption in July. However, expectations have not recovered to anything like November levels (77, compared to July preliminary 59).  

Economic News

The Stock Market and “The Soft Bigotry of Low Expectations”

Trump announces tariffs of “only” 15% on Japanese imported goods, and the market jumps. Source: TradingEconomics. Subsequent accounts note the optimism that a deal with the EU will entail tariffs of “only” 15%. Time consider what the effective tariff rate will be, incorporating this “deal” (which is only as good as the virtual paper it’s written on, given Trump’s predilection for fickleness).    

Scroll to Top