Economic News

Economic News

LA under Occupation: Macro Indicators for California

On June 7, President Trump federalized the California National Guard and deployed troops to LA. This followed instances of aggressively conducted ICE raids against various establishments. Economic activity declined in both LA and rural areas engaged in agriculture. Here are some aggregate indicators for California. Figure 1: California private nonfarm payroll employment (blue), manufacturing (green), and coincident index (tan), all in logs, 2025M05=0. Source: BLS via FRED, BLS, Philadelphia Fed, and author’s calculations. Private NFP declined in June. The coincident index (released today) exhibits a sharp break in June. Finally, manufacturing employment shrinkage accelerated in June. One might not think of manufacturing as a big employer of undocumented immigrants, but in fact the deportation/removal policy will impact this sector tremendously. Notice that given the federalized National Guard deployment is not yet over, and ICE raids continue, it’s likely that we will see more effects in the July statistics. Income statistics will show impacts later on. We have some estimates on the impact in the agricultural sector from Farmonaut (undated). Source: Farmonaut (undated). Without knowing the exact sources, it’s difficult to assess the plausibility of these estimates. But it can’t be a positive economic impact.  

Economic News

Quick and Dirty Check on Whether Steel Prices Have Fallen

Recall CEA has asserted that imported goods prices (incl tariffs) have fallen relative to domestically produced, based on conjoining 2017 IO tables and PCE data. I wondered whether imported goods prices and prices of close substitutes have fallen. To investigate, I do something simpler: look at steel import prices (ex-tariffs) and steel PPI (incl. tariffs). Figure 1: Import price index for iron and steel (tan), PPI for cold rolled steel (blue), both in logs 2025M01=0. Source: BLS, and author’s calculations. Effective June 4, a 50% Section 232 tariff has been in effect, rising from the previous 25%. Since January 2025, the import price index has fallen 3.5%, while the steel/iron PPI has risen 22% (log terms). So as the 50% tariff comes into play, we should expect — on net — continued increases in the price of steel. More discussion at NYT.

Economic News

GAO: “Automatic supports are most effective when they are timely, temporary, targeted, and predictable”

I think we’ll need these sooner than you think. But legislation has just been passed to disable these supports. From GAO, “During Past Recessions and Economic Downturns, These Factors Supported an Effective Fiscal Response,” July 15, 2025. GAO identified four principles that could be used to assess the design or reform of automatic stabilizers. Information from literature and economic and social policy experts suggests that effective automatic stabilizers are timely, temporary, targeted, and predictable. Within those four broad principles, GAO identified eight factors that contribute to the effective design of automatic stabilizers (see table). To my knowledge, recent legislation goes the other direction, at least insofar as Medicaid and SNAP are concerned. Entire report here.  

Economic News

Bertaut, von Beschwitz and Curcuru/FRB: “The International Role of the U.S. Dollar – 2025 Edition”

FEDS note published on Friday: The role of the U.S. dollar has received renewed attention this year. A sharp rise in policy uncertainty has led some to question the strength and stability of the U.S. economy. In particular, increased attention has been paid to the U.S. fiscal outlook, as noted in the recent downgrade by Moody’s of the credit rating on U.S. government debt. And the U.S. has increased its level of tariffs and thereby somewhat reduced its openness to trade flows. Given that most data on international dollar usage is available with a lag, this note is not yet able to show any potential results of the change in the U.S. credit rating or changes to tariff rates in 2025. Rather, it provides a baseline for where the international role of the dollar stood before these announcements. In particular, we can examine the longer-run effects of U.S. sanctions on Russia that were imposed following its invasion of Ukraine in 2022. From the Note: Source: Bertaut et al. (2025).Sc I think there is a bit of understatement with respect to the potential impact of recent statements, including (1) “Liberation Day” and aftermath, (2) ongoing assaults on Fed independence by Trump et al. In particular, Steven Kamin’s analysis of time-variation in the VIX-dollar correlation is noted in this recent Economist piece. Torsten Slok in today’s examination identify what correlates are necessary to explain the recent dollar-interest rate divergence (hint: includes tariffs but also a post-“Liberation Day” dummy, trade policy uncertainty measure, and cumulative mentions of “Mar-o-Lago accord”. Personally, I like looking at the USD-10yr TIPS correlation over three “crisis” episodes: Figure 1: Scatterplot of USD value against 10 year TIPS, around Lehman (blue), around Covid-19 (red), and around “Liberation Day” (green). Source: Federal Reserve Board and Treasury via FRED.  Currently working on a paper with Jeffrey Frankel and Hiro Ito, on assessing central bank holdings of reserves, including gold, and how those holdings have changed with the use of sanctions and in the presence of geopolitical factors. More on that soon.            

Economic News

Consumer Price Level – Alternatives

How’s dropping prices for everyday folks going? Figure 1: CPI all (black), CPI for food (tan), Everyday Price Index (green), all in logs, 2025M01=0. Source: BLS, AIER, and author’s calculations. Median household income CPI is not available for 2025. However, over 2024, it tracks the CPI overall (both in nsa terms) very closely. Hence, extrapolating forward, the CPI all should proxy fairly well median income CPI. As noted in the last post, data collection has declined over the past few years, due to budget constraints. One might hope to access alternative measures would shed light on whether the reported CPI has experienced degradation in accuracy. However, in some instances, alternatives are merely transformations of BLS reported data. For instance, the AIER’s Everyday Price Index (“EPI”) is a weighted average of a subset of CPI categories.  

Economic News

How Much Longer Can We Trust Our Economic Statistics?

The Commerce Department eliminated two advisory committees on economic statistics gathering (see Marketplace). BLS received some additional funds in March as part of a continuing resolution; however the Trump budget proposal includes an 8% reduction in budget in nominal terms. The BLS, tasked with compiling the CPI as well as other labor market indicators (employment, wages) has been already stretched by stagnant funding colliding with escalating costs. Recently, this has affected compilation of the CPI. More and more prices are imputed. Source: Economist. Of course, none of this should come as a surprise. A lot of this was prefigured in the Project 2025 (as I documented here). There’s hardly any money to be saved by slashing in real terms funding for the statistical agencies, so one has to wonder what the underlying philosophy of the Trump administration is. Perhaps, it’s the philosophy of “if a recession occurs, and it’s not measured, will anybody notice?” Perhaps, given Trump’s assault on the Fed’s independence, my guess is that it’s more likely “if inflation accelerates and inflation is not measured, will anybody notice?”. In any event, June’s FT-Booth survey of macroeconomists was interesting insofar as no one thought that the Administration’s measures would improve data quality. Source: FT-Booth June Survey of Macroeconomists. I was in the “very worried” category. Apparently, one macroeconomist would not be worried. I think he/she is in denial.  

Economic News

EJ Antoni/Heritage: “Back from the Brink: Trump’s Economy Soars Instead of Crashing”

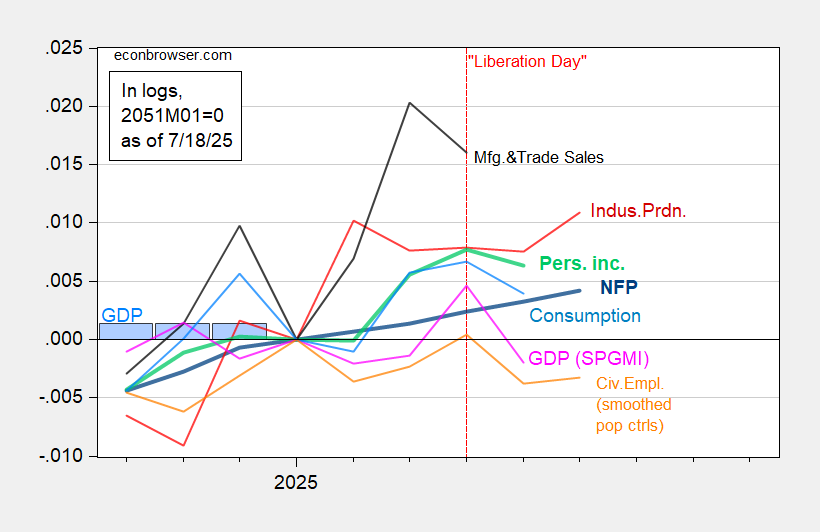
What’s this guy smoking? From the article (originally Wash Examiner): Many so-called experts predicted that President Trump’s economic agenda would usher in an inflationary Armageddon. This projection was so often repeated in the media that many Americans, especially Democrats, believed a depression was imminent. Yet the economy is thoroughly beating expectations and consumers’ expectations are becoming increasingly optimistic. … Just to remind Dr. Antoni, several key indicators are moving down: Figure 1: Nonfarm Payroll incl benchmark revision employment from CES (bold blue), civilian employment using smoothed population controls (orange), industrial production (red), personal income excluding current transfers in Ch.2017$ (bold light green), manufacturing and trade sales in Ch.2017$ (black), consumption in Ch.2017$ (light blue), and monthly GDP in Ch.2017$ (pink), GDP (blue bars), all log normalized to 2021M11=0. 2025Q1 GDP is third release. Source: BLS via FRED, Federal Reserve, BEA, S&P Global Market Insights (nee Macroeconomic Advisers, IHS Markit) (7/2/2025 release), and author’s calculations.  Dr. Antoni makes no mention of GDP (or GDO for that measure). Admittedly, GDP has experienced distortions due to the difficulties measuring the outcomes of tariff-frontrunning. However, “Core GDP” has slowed down as well. Figure 2: Final sales to private domestic purchasers  (black), 2023-2024 stochastic trend (light blue), SPF  May survey median (tan), and Atlanta Fed nowcast of 7/17 (dark blue square), all in bn.Ch.2017$ SAAR. Source: BEA, Philadelphia Fed, Atlanta Fed, and author’s calculations. Finally, Dr. Antoni makes reference to the improvement in expectations. Expectations have indeed improved, but overall sentiment still remains far below levels at the beginning of the Trump administration (shadowed light orange in Figure 3). Figure 3: U.Michigan Economic Sentiment (blue), Conference Board Confidence Index (brown), SF News Sentiment index (green), all demeaned and divided by standard deviation 2021M01-2025m02. Source: UMichigan, Conference Board, SF Fed, and author’s calculations. As for inflation, while it’s come down, expectations have risen since the Trump administration’s advent. Figure 4: Univ of Michigan Survey of Consumers mean expected one year ahead CPI inflation (blue), Survey of Professional Forecasters (brown squares), WSJ survey (green inverted triangle), all in %. Source: U.Michigan, Philadelphia Fed, WSJ. The Michigan survey indicates a jump with “Liberation Day” announcements. It’s come down since, but should the August 1st deadline come and see higher tariffs implemented, expectations might well resurge. Addendum: Since the writing of Dr. Antoni’s piece, the Conference Board’s Leading Economic Index has declined again, signalling recession. Source: Conference Board.  

Scroll to Top