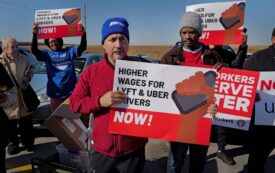
In Chicago, a Coalition of Unions, Community Organizers, and Riders Have Forced Uber to Come to the Table
Will Tanzman, Lori Simmons As the tech industry moves increasingly into alignment with the far right, the issue of worker power has never been more important. The Chicago campaign offers some key lessons. The post In Chicago, a Coalition of Unions, Community Organizers, and Riders Have Forced Uber to Come to the Table appeared first on The Nation.