
Something Is Still Rotten in the City of Philadelphia
Kim Kelly Philly workers went out on strike—and came back with a deal that nobody seems to like. The post Something Is Still Rotten in the City of Philadelphia appeared first on The Nation.

Kim Kelly Philly workers went out on strike—and came back with a deal that nobody seems to like. The post Something Is Still Rotten in the City of Philadelphia appeared first on The Nation.

Jeet Heer The Democratic National Committee’s forthcoming “autopsy” is a cover-up to protect the failed leaders who twice lost to Trump. The post The Democratic Party Remains Committed to Learning Nothing From Its 2024 Defeat appeared first on The Nation.
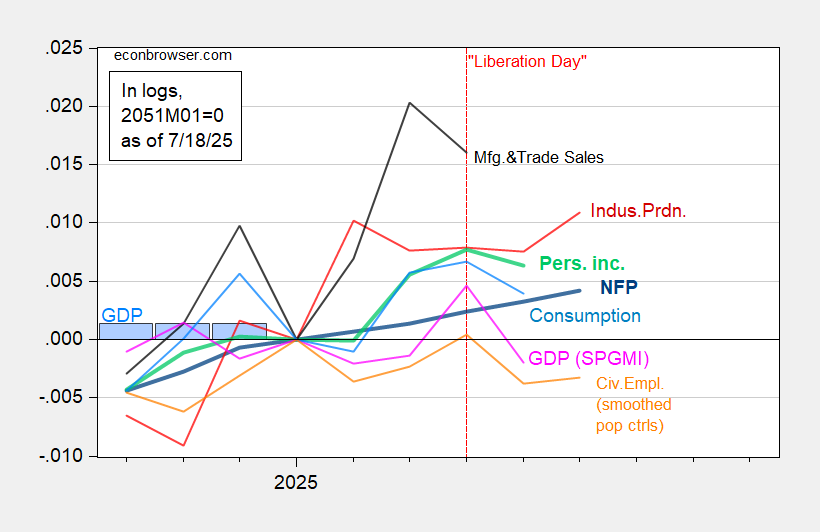
What’s this guy smoking? From the article (originally Wash Examiner): Many so-called experts predicted that President Trump’s economic agenda would usher in an inflationary Armageddon. This projection was so often repeated in the media that many Americans, especially Democrats, believed a depression was imminent. Yet the economy is thoroughly beating expectations and consumers’ expectations are becoming increasingly optimistic. … Just to remind Dr. Antoni, several key indicators are moving down: Figure 1: Nonfarm Payroll incl benchmark revision employment from CES (bold blue), civilian employment using smoothed population controls (orange), industrial production (red), personal income excluding current transfers in Ch.2017$ (bold light green), manufacturing and trade sales in Ch.2017$ (black), consumption in Ch.2017$ (light blue), and monthly GDP in Ch.2017$ (pink), GDP (blue bars), all log normalized to 2021M11=0. 2025Q1 GDP is third release. Source: BLS via FRED, Federal Reserve, BEA, S&P Global Market Insights (nee Macroeconomic Advisers, IHS Markit) (7/2/2025 release), and author’s calculations. Dr. Antoni makes no mention of GDP (or GDO for that measure). Admittedly, GDP has experienced distortions due to the difficulties measuring the outcomes of tariff-frontrunning. However, “Core GDP” has slowed down as well. Figure 2: Final sales to private domestic purchasers (black), 2023-2024 stochastic trend (light blue), SPF May survey median (tan), and Atlanta Fed nowcast of 7/17 (dark blue square), all in bn.Ch.2017$ SAAR. Source: BEA, Philadelphia Fed, Atlanta Fed, and author’s calculations. Finally, Dr. Antoni makes reference to the improvement in expectations. Expectations have indeed improved, but overall sentiment still remains far below levels at the beginning of the Trump administration (shadowed light orange in Figure 3). Figure 3: U.Michigan Economic Sentiment (blue), Conference Board Confidence Index (brown), SF News Sentiment index (green), all demeaned and divided by standard deviation 2021M01-2025m02. Source: UMichigan, Conference Board, SF Fed, and author’s calculations. As for inflation, while it’s come down, expectations have risen since the Trump administration’s advent. Figure 4: Univ of Michigan Survey of Consumers mean expected one year ahead CPI inflation (blue), Survey of Professional Forecasters (brown squares), WSJ survey (green inverted triangle), all in %. Source: U.Michigan, Philadelphia Fed, WSJ. The Michigan survey indicates a jump with “Liberation Day” announcements. It’s come down since, but should the August 1st deadline come and see higher tariffs implemented, expectations might well resurge. Addendum: Since the writing of Dr. Antoni’s piece, the Conference Board’s Leading Economic Index has declined again, signalling recession. Source: Conference Board.
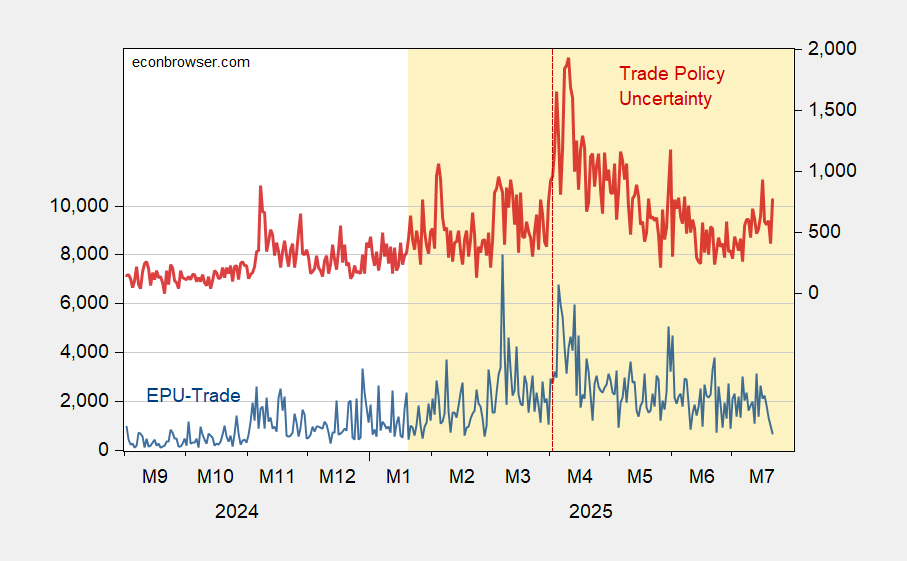
Here’re the Baker-Bloom-Davis categorical trade policy uncertainty measure and the Caldara et al. Trade Policy Uncertainty index. Why are these measures elevated? In my mind, why aren’t they even higher? Figure 1: EPU-trade category (blue, left scale), and Trade Policy Uncertainty index (red, right scale). Source: Baker, Bloom & Davis policyuncertainty.com, and Caldara et al. TPUD. Trade policy is definitely high. In a longer time horizon context: Figure 2: EPU-trade category (blue, left scale), and Trade Policy Uncertainty index (red, right scale). NBER defined peak-to-trough recession dates shaded gray. Source: Baker, Bloom & Davis policyuncertainty.com, Caldara et al., and NBER. Are the textual analyses catching something that’s a figment. I don’t think so. Hatzius/Goldman Sachs graphically illustrates the possible outcomes under certain scenarios. Source: Hatzius, “Global View: Stall Speed,” Goldman Sachs, July 21, 2025. Another perspective on the sources of uncertainty is the TACO phenomenon, as graphically illustrated by Richard Baldwin (for the EU, below): Source: Richard Baldwin.
Deputy managing director’s departure will allow Trump administration to appoint her successor at the fund
Also in today’s newsletter, Japan’s Ishiba presses for quick US trade talks, and Russia’s drone swarms overwhelm Ukraine’s defences
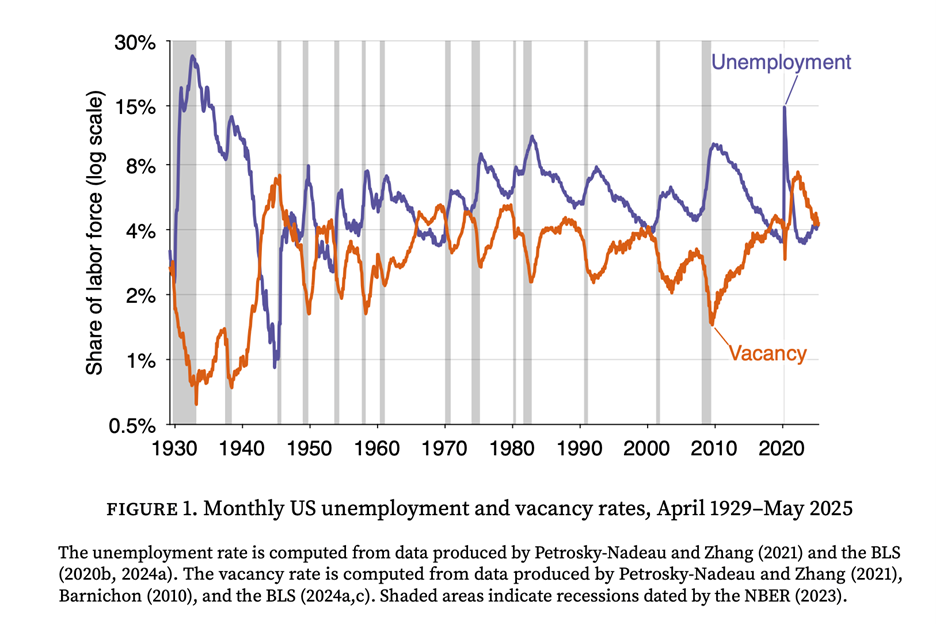
Today we are fortunate to present a guest post written by Pascal Michaillat (UCSC). Is the U.S. economy in a recession? While economists debate and official announcements lag, a new algorithm that I have developed, based on a systematic analysis of labor market data, gives a 71% probability that the US economy was in a recession as of May 2025. The recession might have started as early as late 2023 or mid 2024. Timely recession detection is critical for an effective policy response, yet the official declaration from the NBER’s Business Cycle Dating Committee often arrives up to a year after a recession has begun. Intriguingly, while the NBER’s webpage prominently displays the US unemployment rate over time, the explanation of how recession dates are determined does not mention that the dating committee uses the unemployment rate at all. For policymakers, businesses, and households who need to make decisions in real time, this delay is impractical. But existing real-time indicators that track the unemployment rate, like the Sahm Rule, provide valuable early signals. However, the Sahm and related rules are based on a single, sometimes noisy, measure of the economy. This algorithm builds on the insight that combining labor market data can create a less noisy, more powerful signal. In previous work with Emmanuel Saez, we developed a rule that combined unemployment and vacancy data to detect recessions more quickly and robustly than indicators based on unemployment alone. The foundation of this work is the Beveridge curve: at the onset of every recession, unemployment rises sharply just as job vacancies fall. This new algorithm takes the next logical step: instead of using one specific formula to filter and combine the data, it systematically searches for the optimal way to do so. The goal is to find the best possible lens to view this data. The algorithm first generates millions of potential recession classifiers, each processing the unemployment and vacancy data in a unique way, and each using a unique recession threshold. The algorithm then subjects them to a simple but demanding test: to survive, a classifier must identify all 15 US recessions from 1929 to 2021 without a single false positive. This test leaves us with over two million historically perfect classifiers. Having millions of perfect classifiers creates a new challenge: which one to choose? To solve this, the algorithm evaluates classifiers on two key dimensions: how early they detect a recession (anticipation) and how consistent that signal is (precision). By plotting each classifier’s average detection delay against the standard deviation of the detection delay, the algorithm identifies an anticipation-precision frontier—a group of elite classifiers that offer the optimal trade-off between speed and accuracy. For any given level of precision, no classifier is faster than one on this frontier. From this frontier, the algorithm then selects an ensemble of 7 top-performing classifiers. These are all the classifiers whose detection delay’s standard deviation is below 3 months—which guarantees that the width of the 95% confidence interval for the estimated recession start date is less than 1 year. This classifier ensemble provides a single, real-time recession probability. In every historical recession since 1929, the probability rises sharply near the downturn’s start and stays high until it ends. When I apply the model to the most recent data, it says that the probability of a recession has surged to 71% as of May 2025. This is not a statistical abstraction; it is a direct result of the weakening of the labor market. Since mid-2022, the combination of rising unemployment and falling vacancies has triggered 5 of the 7 classifiers in the ensemble, pushing the recession probability up. The recession probability first became positive late in 2023, when 3 of the 7 classifiers got triggered. The recession further increased in mid 2024, when 2 additional classifiers got activated. Currently, only 2 of the 7 classifiers in the ensemble are inactivated. To verify the model’s reliability, I performed a series of backtests. For instance, I trained the algorithm using data only up to December 1984 and asked it to detect all subsequent recessions. All the classifiers in the ensemble built from 1929–1984 data did very well, correctly identifying all four downturns in the 1985–2021 test period—including the dot-com bust and the Great Recession—without any false positives. Most impressively, even without seeing any data past 1984, the classifier ensemble detected the Great Recession in good time, with its recession probability surging by the summer of 2008, providing a clear and timely warning. In fact, The performance of the algorithm over the entire testing period, 1985–2021, is surprisingly good. Over the 4 recessions of the testing period, the standard deviation of delays averages only 1.4 months, and the mean delay averages only 1.2 months. The classifier ensemble trained on 1929–1984 data assigns a recession probability of 83% to current data (5 of the 6 classifiers in the ensemble are currently triggered). Overall, this new algorithm shows that the labor market is sending an unambiguous signal: the conditions characteristic of a recession are not on the horizon—they are already here. If it turns out, once the dust has settled, that the US economy is not in a recession: what would we learn? In that case, the algorithm could be retrained on the new data, and the classifiers that mistakenly detected the recession would be eliminated. However, given that many of the classifiers on the frontier do signal a recession, the anticipation-precision frontier would shift out. We would therefore learn that detecting recessions with labor market data is harder than we previously thought. This post written by Pascal Michaillat.
Treasury secretary is latest top Trump administration official to criticise the central bank
Buoyant demand for European travel helps budget carrier raise fares and boost profits
When monetary policy is set to meet government budgetary needs, these institutions become piggy banks