UK borrowing rises more than expected in June to £20.7bn
Monthly figures come amid growing expectations of tax increases in Autumn Budget

Monthly figures come amid growing expectations of tax increases in Autumn Budget
Energy systems can shape political institutions and make some nations more vulnerable to trade wars than others
While not without costs, such a move solves some deep economic problems
Beijing makes concerted effort to place officials and push its agenda in Geneva, say western diplomats
Company EVP Stella Li pledges to create more than 5,000 jobs in Britain through dealerships by next year

Kim Kelly Philly workers went out on strike—and came back with a deal that nobody seems to like. The post Something Is Still Rotten in the City of Philadelphia appeared first on The Nation.
Jeet Heer The Democratic National Committee’s forthcoming “autopsy” is a cover-up to protect the failed leaders who twice lost to Trump. The post The Democratic Party Remains Committed to Learning Nothing From Its 2024 Defeat appeared first on The Nation.
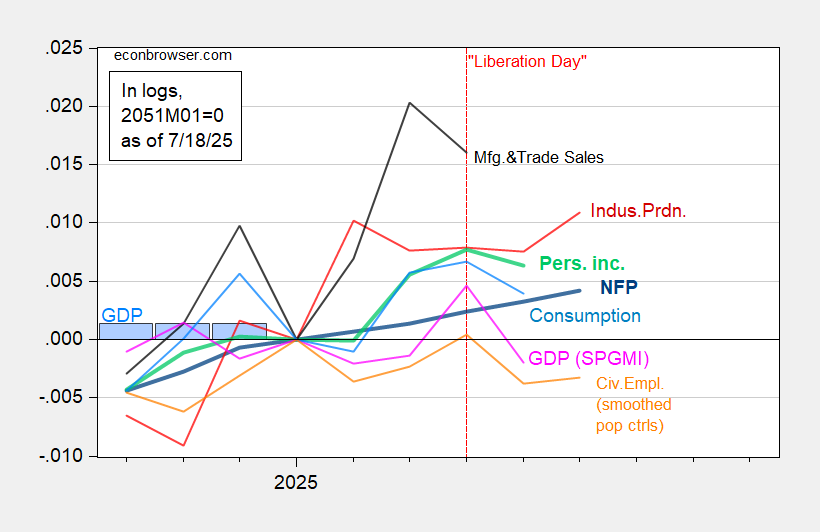
What’s this guy smoking? From the article (originally Wash Examiner): Many so-called experts predicted that President Trump’s economic agenda would usher in an inflationary Armageddon. This projection was so often repeated in the media that many Americans, especially Democrats, believed a depression was imminent. Yet the economy is thoroughly beating expectations and consumers’ expectations are becoming increasingly optimistic. … Just to remind Dr. Antoni, several key indicators are moving down: Figure 1: Nonfarm Payroll incl benchmark revision employment from CES (bold blue), civilian employment using smoothed population controls (orange), industrial production (red), personal income excluding current transfers in Ch.2017$ (bold light green), manufacturing and trade sales in Ch.2017$ (black), consumption in Ch.2017$ (light blue), and monthly GDP in Ch.2017$ (pink), GDP (blue bars), all log normalized to 2021M11=0. 2025Q1 GDP is third release. Source: BLS via FRED, Federal Reserve, BEA, S&P Global Market Insights (nee Macroeconomic Advisers, IHS Markit) (7/2/2025 release), and author’s calculations. Dr. Antoni makes no mention of GDP (or GDO for that measure). Admittedly, GDP has experienced distortions due to the difficulties measuring the outcomes of tariff-frontrunning. However, “Core GDP” has slowed down as well. Figure 2: Final sales to private domestic purchasers (black), 2023-2024 stochastic trend (light blue), SPF May survey median (tan), and Atlanta Fed nowcast of 7/17 (dark blue square), all in bn.Ch.2017$ SAAR. Source: BEA, Philadelphia Fed, Atlanta Fed, and author’s calculations. Finally, Dr. Antoni makes reference to the improvement in expectations. Expectations have indeed improved, but overall sentiment still remains far below levels at the beginning of the Trump administration (shadowed light orange in Figure 3). Figure 3: U.Michigan Economic Sentiment (blue), Conference Board Confidence Index (brown), SF News Sentiment index (green), all demeaned and divided by standard deviation 2021M01-2025m02. Source: UMichigan, Conference Board, SF Fed, and author’s calculations. As for inflation, while it’s come down, expectations have risen since the Trump administration’s advent. Figure 4: Univ of Michigan Survey of Consumers mean expected one year ahead CPI inflation (blue), Survey of Professional Forecasters (brown squares), WSJ survey (green inverted triangle), all in %. Source: U.Michigan, Philadelphia Fed, WSJ. The Michigan survey indicates a jump with “Liberation Day” announcements. It’s come down since, but should the August 1st deadline come and see higher tariffs implemented, expectations might well resurge. Addendum: Since the writing of Dr. Antoni’s piece, the Conference Board’s Leading Economic Index has declined again, signalling recession. Source: Conference Board.
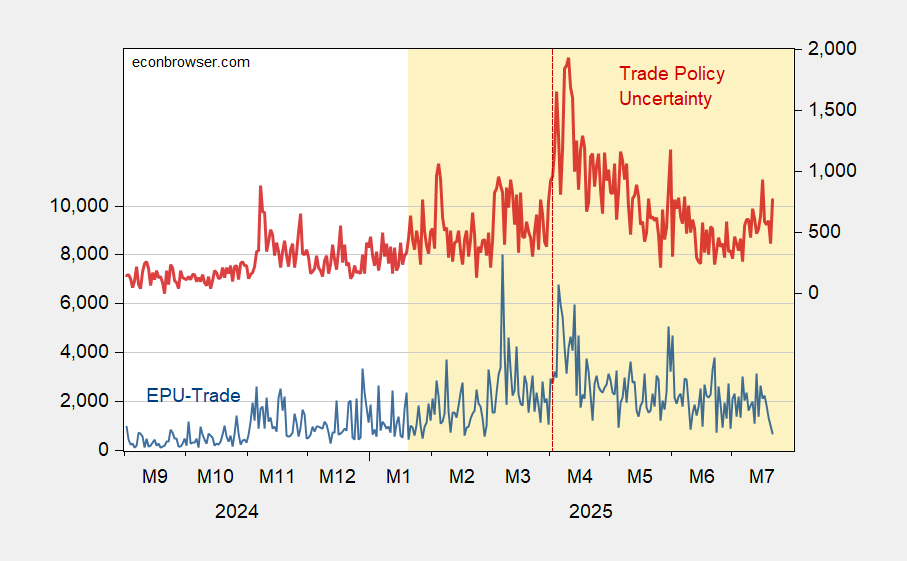
Here’re the Baker-Bloom-Davis categorical trade policy uncertainty measure and the Caldara et al. Trade Policy Uncertainty index. Why are these measures elevated? In my mind, why aren’t they even higher? Figure 1: EPU-trade category (blue, left scale), and Trade Policy Uncertainty index (red, right scale). Source: Baker, Bloom & Davis policyuncertainty.com, and Caldara et al. TPUD. Trade policy is definitely high. In a longer time horizon context: Figure 2: EPU-trade category (blue, left scale), and Trade Policy Uncertainty index (red, right scale). NBER defined peak-to-trough recession dates shaded gray. Source: Baker, Bloom & Davis policyuncertainty.com, Caldara et al., and NBER. Are the textual analyses catching something that’s a figment. I don’t think so. Hatzius/Goldman Sachs graphically illustrates the possible outcomes under certain scenarios. Source: Hatzius, “Global View: Stall Speed,” Goldman Sachs, July 21, 2025. Another perspective on the sources of uncertainty is the TACO phenomenon, as graphically illustrated by Richard Baldwin (for the EU, below): Source: Richard Baldwin.
Deputy managing director’s departure will allow Trump administration to appoint her successor at the fund