Trump freezes export controls to secure trade deal with China
US officials have been warned to avoid tough moves against Beijing as Stockholm hosts third round of negotiations

US officials have been warned to avoid tough moves against Beijing as Stockholm hosts third round of negotiations
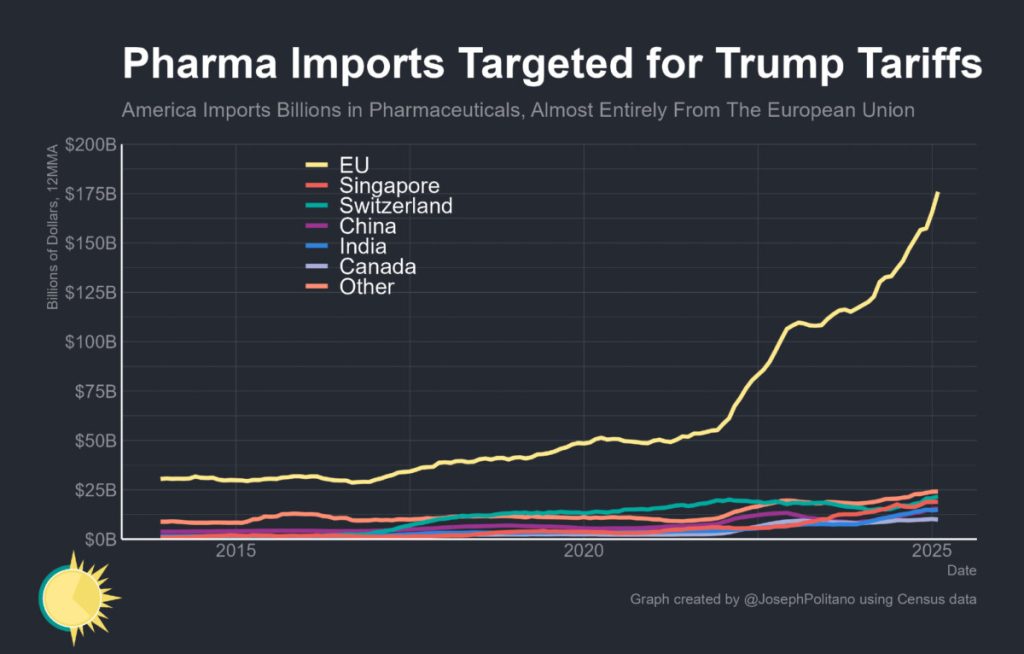
The just-announced trade “deal” (what’s the enforcement mechanism?) apparently covers pharmaceuticals. Where do we get most of our pharma (by value)? From Joey Politano, the answer: Source: Politano. I don’t think there’s anything on paper (and even if there were, would it mean much?). So, not the 50% I pondered back in May, but still 15% is above 10%. * To be clear, we do not know if Mr. Trump is taking a GLP-1. ** Back of the envelope calculation of tax increase. Effective tariff rate rises from 1.2% to 15%; 2024 imports from EU equals approx 600 bn. Assuming no price response (price elasticity is 0), and US as small country, this is a tax increase of $83bn/year, or $70 bn/year assuming a price elasticity of demand of unity.
Also in today’s newsletter, Taiwanese voters reject attempt to recall KMT lawmakers, and China proposes global body to govern AI
Relief at avoiding trade war is tinged with regret at not taking firmer stand from the start
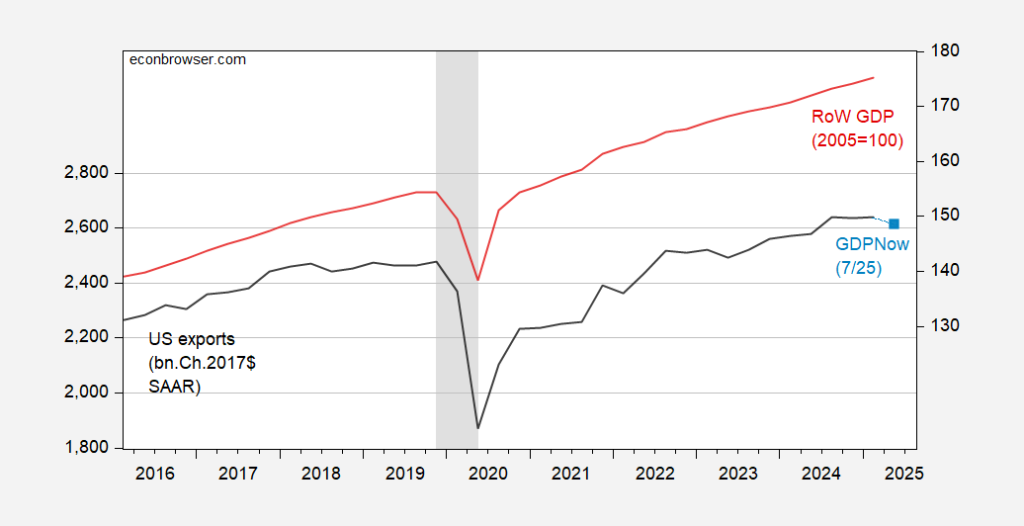
What else did you expect? Figure 1: US exports of goods and services (black, left log scale), GDPNow nowcast (light blue square, left log scale), both in bn.Ch.2017$ SAAR; export weighted rest-of-world GDP, 2005=100 (red, right scale). NBER defined peak-to-trough recession dates shaded gray. Source: BEA 2025Q1 3rd release, Atlanta Fed, Dallas Fed, NBER and author’s calculations. So in Q1, RoW GDP rose but real US exports fell; more telling, the dollar depreciated in inflation adjusted term from January to March, which would have in normal times induced an increase in exports…(dollar depreciation January to June is 6.5% in log terms). The Atlanta Fed’s 7/25 nowcast indicates 3.3% q/q annualized (0.9% q/q) decline in Q2 real exports (incorporates monthly trade data through May’s numbers).
Jay Powell expected to widen rift with Trump by keeping monetary policy unchanged at Wednesday’s meeting

Not that I’m complaining. From SCMP via Bloomberg: US and China are expected to extend their tariff truce by another three months, the South China Morning Post reported, citing unnamed sources. The two countries will not impose additional tariffs on each other during the extension, one of the sources told the newspaper. The current pause was to end Aug. 12. So, the waiting game begins again… Figure 1: EPU-trade category (blue, left scale), and Trade Policy Uncertainty index (red, right scale). Source: Baker, Bloom & Davis policyuncertainty.com, and Caldara et al. TPUD.
US president announces agreement after talks with European Commission head Ursula von der Leyen at Turnberry
Plus, tensions over Fed interest rate move, Starmer to talk steel with Trump, and earnings season hits a peak
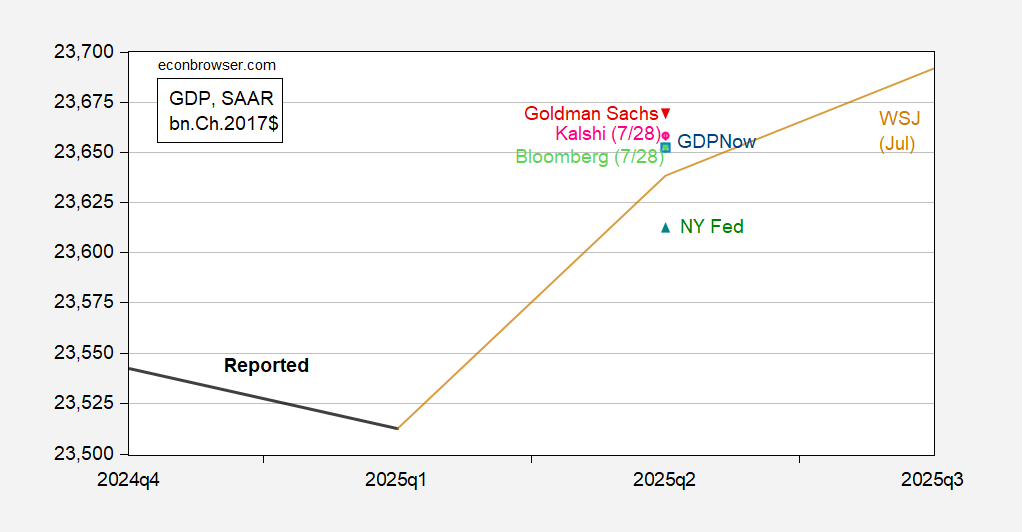
Kalshi today. 2.4% from GDPNow and the Bloomberg consensus. Figure 1: GDP as reported (bold black), GDPNow (blue open square), NY Fed (light blue triangle) WSJ July survey mean (tan), Kalshi bet, 7/28 (pink circle), Bloomberg consensus as of 7/28 (light green circle), all in bn.Ch.2017$, SAAR. All predictions as of 7/25 unless otherwise indicated. Source: BEA 2025Q1 3rd release, WSJ survey, Bloomberg, Atlanta Fed, NY Fed, Goldman Sachs, Kalshi.com, and author’s calculations.