Economic News

Economic News

CEA: “Imported Goods Have Been Getting Cheaper Relative to Domestically Produced Goods”

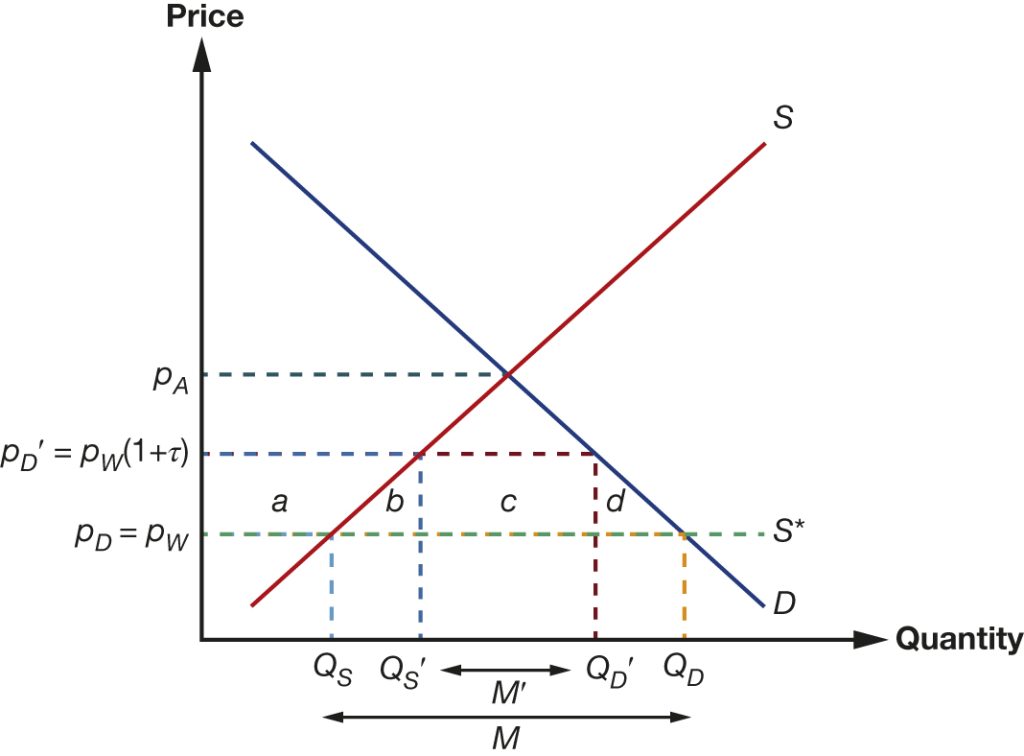
That’s the title of a report by the Trump administration CEA earlier this month. It’s an interesting question whether this is the relevant question or not. What the CEA analysis does is to use the 2017 Input-Output tables to determine what the final goods prices (in CPI or PCE deflator) do, taking into account the amount of imports used in each category. This seems like a reasonable way to proceed, until one thinks about how tariffs work. Consider the simplest case, where the US is a small country. Source: Chinn and Irwin, International Economics (2025). Then using the methodology of the Trump CEA, the importance of tariffs for final demand prices is denoted by M×(Pw(1+τ)-Pw.) [I hold import quantity at pre-tariff level M because CEA uses 2017 IO tables]. However, as is known from basic economics (like the kind one learns in first course econ in undergrad, or even high school), import competing domestic firms also raise their prices. Hence, the prices are raised for quantity M, as well as quantity Qs.  In the figure above, this doesn’t change much. However, consider an alternative, where domestic production is much larger relative to imports: Now, price increases apply to quantities 0 to Qs and M. In other words, a much larger share of final production. In other words, the CEA calculations are ignoring the presence of domestic alternatives. For some products (think coffee), there is virtually no domestic production. But for others, there are. Consider steel — Nucor raised their prices when tariffs were announced, even before they were implemented. By the way, if the imported goods are durables, I would expect that domestic, import-competing firms would raise their prices before tariffed goods entered (recall, the universal 10% tariff was only implemented in April, and the CEA analysis applies to final prices through May). The CEA report cites a Fed analysis which uses similar methodology to theirs. I will merely observe that in the case of imported Chinese goods, there are fewer import-competing domestic firms, so the preceding critique need not apply as forcefully.

Economic News

EJ Antoni on the No Tariff Pass Through Thesis

From Heritage Chief Economist EJ Antoni on X: N.B.: this is an INDIRECT indicator of tariffs not being passed on b/c import prices have fallen relative to their domestic counterparts; that’s the result of a substitution effect and foreign producers’ attempt to retain market share by reducing their prices relatively speaking: · Jul 17 Import prices just came in WAAAY below expectations: June was up just 0.1% M/M, -0.2% Y/Y, while May saw a huge downward revision from flat to -0.4% M/M; still waiting for tariffs to be passed on by foreign producers… Note that Dr. Antoni is apparently using the all commodity imports price index. I think that, since no tariffs have been applied to oil, it would be more appropriate to use the import price index ex-petroleum. Using this index, and Instead of plotting rates of change, I show price indices relative to 2025M04, given that the 10% tariffs were effective in early April. Figure 1: Import price index for all commodities (blue), for commodities ex-petroleum (tan), all in logs 2025M04=0. Source: BLS via FRED, and author’s calculations. Using this more appropriate series, I do not see the price decrease the Dr. Antoni refers to. As an aside, I am still waiting for Dr. Antoni to declare the end of the recession he claimed started in 2022.  

Economic News

Thanks, Drumpf

WSJ mean survey forecast relative to 2023-2024 trend. Figure 1: GDP (bold black), 2023-2024 stochastic trend (blue), WSJ July mean (tan), WSJ 20% high/low band (gray lines), GDPNow of 7/17 (light blue square), all in bn.Ch.2017$ SAAR. Source: BEA, WSJ, Atlanta Fed, and author’s calculations.

Economic News

Economic Policy Uncertainty and Economic Uncertainty

Policy uncertainty has remains high; does it matter for economic uncertainty? Figure 1: EPU-trade category (blue, left scale), and Trade Policy Uncertainty index (red, right scale). Source: Baker, Bloom & Davis policyuncertainty.com, and Caldara et al. TPUD.   Figure 2: EPU (blue, left scale), and centered 7 day moving average (red, right scale), SF Fed News Sentiment index (green). Source: policyuncertainty.com, SF Fed, and author’s calculations.   Figure 3: EPU (legacy) (blue, left scale), Jurado, Ludvigson, Ng (JLN) macro uncertainty index (tan, right scale). NBER defined peak to trough recession dates shaded gray. Source: policyuncertainty.com, Ludvigson, and NBER.    Figure 4: EPU (legacy) (blue, left scale), Jurado, Ludvigson, Ng (JLN) financial uncertainty index (tan, right scale). NBER defined peak to trough recession dates shaded gray. Source: policyuncertainty.com, Ludvigson, and NBER.  In a bivariate setting, one rejects the null hypothesis that JLN Granger causes EPU, but one can not reject the null hypothesis that EPU causes JLN, at conventional levels. As of April (the last available observation), the JLN-macro series was over one standard deviation above the mean. And JLN (AEJ-Macro, 2021) suggests that financial uncertainty is an exogenous determinant of the business cycle activity.  

Scroll to Top