Economic News

Economic News

Even *More* Depressing Pictures from the Labor Market

You think the official BLS NFP series is worrying, consider the alternatives: Figure 1: BLS establishment nonfarm payroll (NFP) July series (bold blue), Jun series (light blue), Philadelphia Fed early benchmark (green), and experimental BLS household series adjusted to NFP concept, with smoothed population controls, centered 3 month moving average (tan), all in logs 2024M10=0. Source: BLS via FRED, BLS, Philadelphia Fed, and author’s calculations. Figure 2: BLS establishment private nonfarm payroll (NFP) July series (bold blue), June series (light blue), and ADP series (tan), all in logs 2024M10=0. Source: BLS, ADP via FRED, and author’s calculations. Finally, the household series: Figure 3: Experimental BLS household series, with smoothed population controls, (bold black), and centered 3 month moving average (tan), all in logs 2024M10=0. Source: BLS via FRED, and author’s calculations.

Economic News

How Are Wisconsin Exports, Manufacturing Doing under Trump Trade War 2.0?

Discussed the employment numbers on WPR this morning. One question came up, which inspired this post – how’s Wisconsin doing, tradewise, given the states’ trade/manufacturing dependence. Figure 1: 12 month trailing moving average of Wisconsin goods exports deflated by US goods export price index (red), imports deflated by US goods imports price index (blue), both in millions 2000$, monthly. Source: Census, BLS, via FRED, and author’s calculations. Real exports were declining even before the election, but showed a drop in in November, onward. Imports started dropping in March. Note that for a variety of reasons, the state level imports and exports are subject to some additional error (e.g., grain exports might be attributed to Louisiana rather than Wisconsin because that’s where they’re exported from; still, there’s little reason to believe the bias has changed since before “Liberation Day”. What about manufacturing? Figure 2: Wisconsin manufacturing employment,000’s (black line, left log scale), Wisconsin real manufacturing value added, mn Ch.2017$, SAAR (blue bars, right log scale). Source: BLS, BEA. We don’t have value added – the most comprehensive indicator – for the 2nd quarter, which would include post-“Liberation Day” data. However, growth seems to have tailed off. Manufacturing employment is now declining in June (preliminary). Since (3 month) changes in Wisconsin manufacturing employment are correlated with changes in US manufacturing employment with a coefficient of 0.91 (R2 of 0.48, 2022-2025), it’s likely that

Economic News

UW Now Live: “Trumponomics” and the state of the U.S. economy”

This week’s livestream featuring Menzie Chinn and Lydia Cox, moderated by Mike Knetter, is Tuesday, Aug. 5, at 7 p.m. CDT (hosted by the Wisconsin Alumni Association): Register here. In the first half of the year, the Trump administration has reshaped many aspects of economic policy, often in ways that are at odds with the views of outside economists. As Trump’s economic agenda takes shape, many are wondering about its impact. How are tariffs affecting prices for consumers? Are the biggest impacts behind us or yet to come? How will the new federal budget affect the deficit? Will the administration exert more pressure on the Federal Reserve and its chair? And what does this all mean for the average American? My pictorial assessment: Figure 1: Nonfarm Payroll from CES (bold blue), implied NFP Bloomberg consensus as of 7/1 (blue +), civilian employment with smoothed population controls (orange), industrial production (red), personal income excluding current transfers in Ch.2017$ (bold light green), manufacturing and trade sales in Ch.2017$ (black), consumption in Ch.2017$ (light blue), and monthly GDP in Ch.2017$ (pink), GDP (blue bars), all log normalized to 2021M11=0. Source: BLS via FRED, Federal Reserve, BEA 2025Q2 advance release, S&P Global Market Insights (nee Macroeconomic Advisers, IHS Markit) (7/1/2025 release), and author’s calculations.  The labor market really does look like it’s slowing down… Figure 2: Private nonfarm payroll employment, July release (bold black), Jun release (purple), ADP July release (green), all s.a.,  in logs, 2025M01=0. Source: BLS, ADP via FRED, and author’s calculations.        

Economic News

EPU and EPU-Trade Policy Uncertainty Measured

Through 8/3: Figure 1: EPU (blue, left scale), EPU-trade (green, right scale). Source: policyuncertainty.com.  Trade policy uncertainty, I can see why that’s risen. Economic Policy Uncertainty? Well, if you start disassembling the economic data infrastructure that underpins TIPS, Social Security COLAs, and inflation numbers necessary for private and public decision-making, maybe this is the least uncertainty you can expect.  

Economic News

Trump’s Willing Enabler

From the NYT: Two days after President Trump fired the top labor official in charge of compiling statistics on employment, Kevin Hassett, the director of the White House National Economic Council, insisted on Sunday that the administration was “absolutely not” shooting the messenger on the heels of a poor jobs report. But Mr. Hassett repeatedly declined to furnish detailed evidence that would substantiate the president’s claims that the data had been rigged or manipulated to hurt him politically. … on “Fox News Sunday,” Mr. Hassett claimed there were “partisan patterns” in the jobless data, and said that “data can’t be propaganda.” It is important to recall that Dr. Hassett both authored Dow 36,000 in 1999, and applied a quadratic specification to predict covid fatalities.

Economic News

Business Cycle Indicators – A Turning Point?

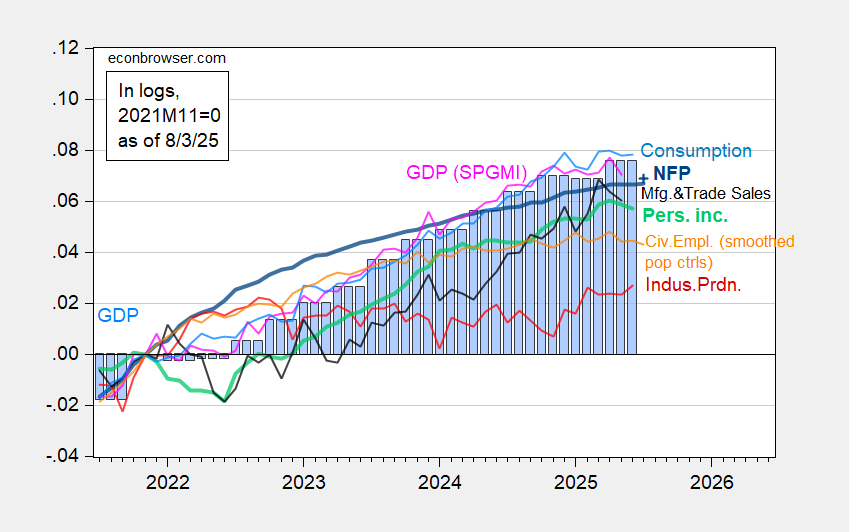
Maybe, maybe not. With the employment release of Friday, here’re the pictures, first of NBER’s BCDC key indicators, and second of alternative indicators (recalling all the most recent data will be revised): Figure 1: Nonfarm Payroll from CES (bold blue), implied NFP Bloomberg consensus as of 7/1 (blue +), civilian employment with smoothed population controls (orange), industrial production (red), personal income excluding current transfers in Ch.2017$ (bold light green), manufacturing and trade sales in Ch.2017$ (black), consumption in Ch.2017$ (light blue), and monthly GDP in Ch.2017$ (pink), GDP (blue bars), all log normalized to 2021M11=0. Source: BLS via FRED, Federal Reserve, BEA 2025Q2 advance release, S&P Global Market Insights (nee Macroeconomic Advisers, IHS Markit) (7/1/2025 release), and author’s calculations.  The big NFP miss, usually not visible, is readily apparent in this graph. That’s because of the revisions to previous months. While small relative to annual benchmark revisions, they are noticeable here. Big downward revisions, if memory serves me correctly, are seen around turning points. If one were looking for succor in the household survey, one won’t find it. The civilian employment series has been flat for months. And if one believes trends in the household employment series presage recessions at an earlier point than the establishment series, then start worrying. Just to recap, consumption, personal income and monthly GDP are all below recent peaks. Here are some alternative monthly indicators (drawn on same vertical scale as Figure 2): Figure 2: Implied Nonfarm Payroll early benchmark (NFP) (bold blue), civilian employment adjusted to nonfarm payroll concept, with smoothed population controls (orange), manufacturing production (red), vehicle miles traveled (teal), real retail sales (black), and coincident index in Ch.2017$ (pink), BTS Freight Services Index (brown), GDO (blue bars), all log normalized to 2021M11=0. Retail sales deflated by chained CPI, seasonally Source: Philadelphia Fed [1], Philadelphia Fed [2], Federal Reserve via FRED, BEA 2025Q2 advance release, DoT BTS, and author’s calculations. As discussed here, Mr. Trump’s assertions of rigged data are wildly unjustified, given private NFP as measured by ADP shows the same pattern as the current BLS private NFP series, but on  a lower trajectory. If anything, the pre-revision series was less plausible, given the ADP series trajectory. Retail sales, civilian employment adjusted to NFP concept, and manufacturing production are all below recent peak (albeit insignificantly in the latter case). The coincident index is the only series that is unambiguously rising. The coincident index is based labor market data, so as long as NFP is rising, it’ll rise. With revised employment data, the next iteration of of the coincident indicator will look noticeably different. So until the establishment series trend downwards, I reserve judgment.        

Economic News

Consumers Vote on Economic Prospects

Durables consumption has experienced extreme volatility over the last 9 months (since the election). However, services and nondurables should follow the permanent income hypothesis — at least halfway (DSGE’s usually incorporate about 50% hand-to-mouth consumers). So what do we see? Figure 1: Sum of nondurables and services consumption (blue, left log scale), 2023M11-2024M10 stochastic trend (light blue line, left scale),durables consumption (red, right log scale), 2023M11-2024M10 stochastic trend (light red, right scale), all in bn.Ch.2017$ SAAR. Orange shading denotes Trump 2.0 administration; orange dashed line at 2025M04. Source: BEA, July release, and author’s calculations. The gap between services consumption and trend is even larger. To the extent that services consumption is driven by the permanent income hypothesis (even if up to half of consumers are hand-to-mouth), this means there’s been downshift in perceived future stream of income.

Scroll to Top