Economic News

Economic News

EJ Antoni on the No Tariff Pass Through Thesis

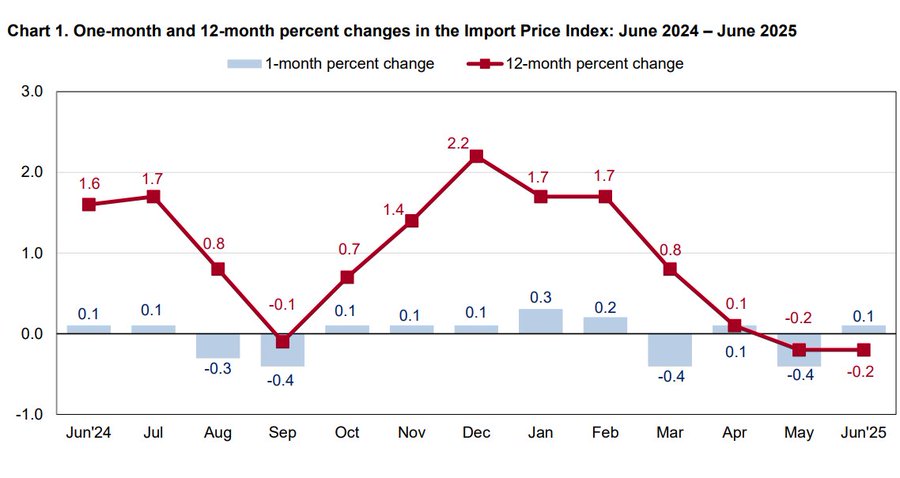
From Heritage Chief Economist EJ Antoni on X: N.B.: this is an INDIRECT indicator of tariffs not being passed on b/c import prices have fallen relative to their domestic counterparts; that’s the result of a substitution effect and foreign producers’ attempt to retain market share by reducing their prices relatively speaking: · Jul 17 Import prices just came in WAAAY below expectations: June was up just 0.1% M/M, -0.2% Y/Y, while May saw a huge downward revision from flat to -0.4% M/M; still waiting for tariffs to be passed on by foreign producers… Note that Dr. Antoni is apparently using the all commodity imports price index. I think that, since no tariffs have been applied to oil, it would be more appropriate to use the import price index ex-petroleum. Using this index, and Instead of plotting rates of change, I show price indices relative to 2025M04, given that the 10% tariffs were effective in early April. Figure 1: Import price index for all commodities (blue), for commodities ex-petroleum (tan), all in logs 2025M04=0. Source: BLS via FRED, and author’s calculations. Using this more appropriate series, I do not see the price decrease the Dr. Antoni refers to. As an aside, I am still waiting for Dr. Antoni to declare the end of the recession he claimed started in 2022.  

Economic News

Thanks, Drumpf

WSJ mean survey forecast relative to 2023-2024 trend. Figure 1: GDP (bold black), 2023-2024 stochastic trend (blue), WSJ July mean (tan), WSJ 20% high/low band (gray lines), GDPNow of 7/17 (light blue square), all in bn.Ch.2017$ SAAR. Source: BEA, WSJ, Atlanta Fed, and author’s calculations.

Economic News

Economic Policy Uncertainty and Economic Uncertainty

Policy uncertainty has remains high; does it matter for economic uncertainty? Figure 1: EPU-trade category (blue, left scale), and Trade Policy Uncertainty index (red, right scale). Source: Baker, Bloom & Davis policyuncertainty.com, and Caldara et al. TPUD.   Figure 2: EPU (blue, left scale), and centered 7 day moving average (red, right scale), SF Fed News Sentiment index (green). Source: policyuncertainty.com, SF Fed, and author’s calculations.   Figure 3: EPU (legacy) (blue, left scale), Jurado, Ludvigson, Ng (JLN) macro uncertainty index (tan, right scale). NBER defined peak to trough recession dates shaded gray. Source: policyuncertainty.com, Ludvigson, and NBER.    Figure 4: EPU (legacy) (blue, left scale), Jurado, Ludvigson, Ng (JLN) financial uncertainty index (tan, right scale). NBER defined peak to trough recession dates shaded gray. Source: policyuncertainty.com, Ludvigson, and NBER.  In a bivariate setting, one rejects the null hypothesis that JLN Granger causes EPU, but one can not reject the null hypothesis that EPU causes JLN, at conventional levels. As of April (the last available observation), the JLN-macro series was over one standard deviation above the mean. And JLN (AEJ-Macro, 2021) suggests that financial uncertainty is an exogenous determinant of the business cycle activity.  

Economic News

Tariffs in the Data

From CPI, note the CPI furniture and appliances category: Figure 1: CPI all urban (blue), CPI commodities (green), and CPI – furniture and household appliances (tan), all in logs, 2025M01=0. Source: BLS, and author’s calculations. And, on a much more granular level, from Cavallo et al. (July 17, 2025): Source: Cavallo,  et al. (July 17, 2025). Not only have tariffed goods prices risen, domestic competitor prices have as well. Thanks, Drumpf!  

Scroll to Top