Economic News

Economic News

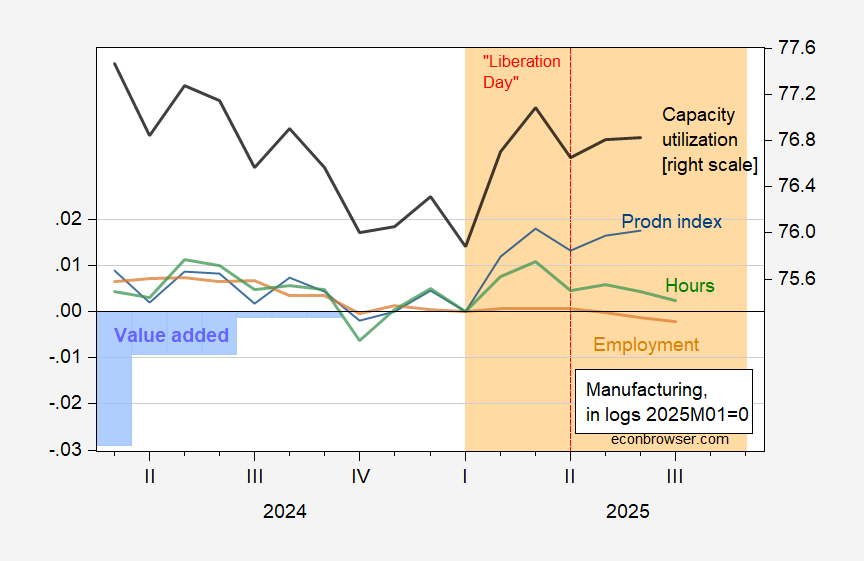
Manufacturing on the Ropes?

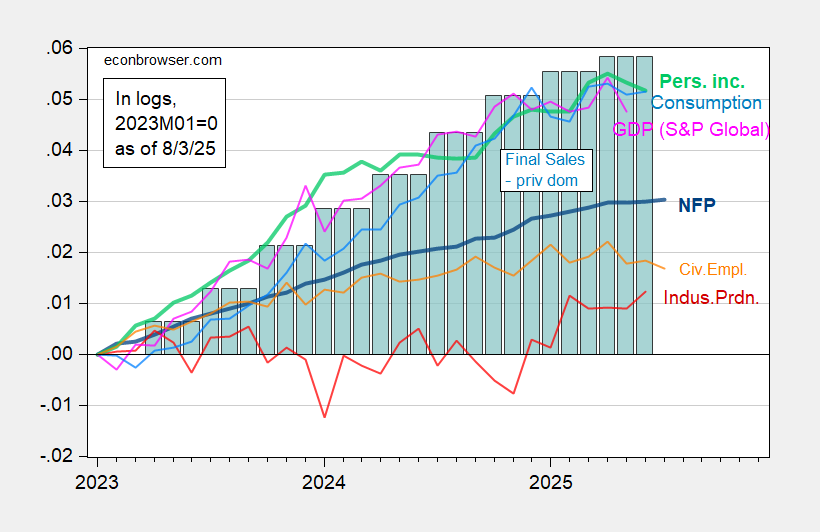
Manufacturing employment, hours, capacity utilization down since March 2025 (pre-“Liberation Day”); manufacturing production (Fed index) flat since March. Figure 1: Manufacturing employment, all employees (brown), manufacturing aggregate hours (green), manufacturing production (blue), real value added in manufacturing (blue bars), all in logs,  2025M01=0; manufacturing capacity utilization (bold black line, right scale). Aggregate hours calculated by multiplying average weekly hours times employment of production and nonsupervisory workers. Source: BLS, Federal Reserve, BEA, and author’s calculations.  Notice that since we are indexing to 2025M01=0, the fact that it’s difficult to see the value added series over the last two quarters means that value added has been essentially flat over that period. These are all backwards looking indicators. The ISM manufacturing PMI – new orders component doesn’t look too promising. And all this is before the tariffs take full effect, and retaliation (aside from China). Source: ISM, accessed 8/7/2025.

Economic News

CalculatedRisk (Still) on Recession Watch

Bill McBride’s assessment here. In early April, I went on recession watch, but I’m still not yet predicting a recession for several reasons: the U.S. economy is very resilient and was on solid footing at the beginning of the year, and perhaps the tariffs are not enough to topple the economy. In the short term, it is mostly trade policy that will negatively impact the economy. However, there other aspects of policy that bear watching – especially immigration. Yesterday, Mark Zandi was stating his case for being wary: Moody’s Analytics chief economist Mark Zandi said the U.S. economy is “on the precipice of recession,” citing indicators from last week’s economic data releases. In a social media post Monday, Zandi pointed to stagnant consumer spending, contracting construction and manufacturing sectors and projected employment declines. Rising inflation makes it difficult for the Federal Reserve to provide economic stimulus, the economist said While unemployment remains low, Zandi attributed this to declining labor force growth rather than economic strength. “The foreign-born workforce is shrinking and labor force participation” is falling, he wrote. Here’s my picture of the state of the economy, with series not restricted to NBER BCDC’s key indicators, and substituting in final sales to private domestic purchasers for GDP: Figure 1: Nonfarm payroll employment (bold blue), personal income excluding current transfers (bold light green), civilian employment, experimental series with smoothed population controls (orange), industrial production (red), S&P Global monthly GDP (pink), and final sales to private domestic purchasers (teal bars), all in logs 2023M01=0.  Personal income, consumption, civilian employment, and monthly GDP are all below recent peaks. Industrial production is up, but nonfarm payroll employment is essentially flat over the last three months (33K/mo). NBER BCDC places highest emphasis on employment (presumably NFP) and personal income. Because the Sahm rule hasn’t been triggered and nonfarm payroll employment continues to rise, I — like CR — don’t think the downturn has arrived as of July (recalling we’re in August, and all the July numbers will be revised).  

Economic News

Even *More* Depressing Pictures from the Labor Market

You think the official BLS NFP series is worrying, consider the alternatives: Figure 1: BLS establishment nonfarm payroll (NFP) July series (bold blue), Jun series (light blue), Philadelphia Fed early benchmark (green), and experimental BLS household series adjusted to NFP concept, with smoothed population controls, centered 3 month moving average (tan), all in logs 2024M10=0. Source: BLS via FRED, BLS, Philadelphia Fed, and author’s calculations. Figure 2: BLS establishment private nonfarm payroll (NFP) July series (bold blue), June series (light blue), and ADP series (tan), all in logs 2024M10=0. Source: BLS, ADP via FRED, and author’s calculations. Finally, the household series: Figure 3: Experimental BLS household series, with smoothed population controls, (bold black), and centered 3 month moving average (tan), all in logs 2024M10=0. Source: BLS via FRED, and author’s calculations.

Economic News

How Are Wisconsin Exports, Manufacturing Doing under Trump Trade War 2.0?

Discussed the employment numbers on WPR this morning. One question came up, which inspired this post – how’s Wisconsin doing, tradewise, given the states’ trade/manufacturing dependence. Figure 1: 12 month trailing moving average of Wisconsin goods exports deflated by US goods export price index (red), imports deflated by US goods imports price index (blue), both in millions 2000$, monthly. Source: Census, BLS, via FRED, and author’s calculations. Real exports were declining even before the election, but showed a drop in in November, onward. Imports started dropping in March. Note that for a variety of reasons, the state level imports and exports are subject to some additional error (e.g., grain exports might be attributed to Louisiana rather than Wisconsin because that’s where they’re exported from; still, there’s little reason to believe the bias has changed since before “Liberation Day”. What about manufacturing? Figure 2: Wisconsin manufacturing employment,000’s (black line, left log scale), Wisconsin real manufacturing value added, mn Ch.2017$, SAAR (blue bars, right log scale). Source: BLS, BEA. We don’t have value added – the most comprehensive indicator – for the 2nd quarter, which would include post-“Liberation Day” data. However, growth seems to have tailed off. Manufacturing employment is now declining in June (preliminary). Since (3 month) changes in Wisconsin manufacturing employment are correlated with changes in US manufacturing employment with a coefficient of 0.91 (R2 of 0.48, 2022-2025), it’s likely that

Economic News

UW Now Live: “Trumponomics” and the state of the U.S. economy”

This week’s livestream featuring Menzie Chinn and Lydia Cox, moderated by Mike Knetter, is Tuesday, Aug. 5, at 7 p.m. CDT (hosted by the Wisconsin Alumni Association): Register here. In the first half of the year, the Trump administration has reshaped many aspects of economic policy, often in ways that are at odds with the views of outside economists. As Trump’s economic agenda takes shape, many are wondering about its impact. How are tariffs affecting prices for consumers? Are the biggest impacts behind us or yet to come? How will the new federal budget affect the deficit? Will the administration exert more pressure on the Federal Reserve and its chair? And what does this all mean for the average American? My pictorial assessment: Figure 1: Nonfarm Payroll from CES (bold blue), implied NFP Bloomberg consensus as of 7/1 (blue +), civilian employment with smoothed population controls (orange), industrial production (red), personal income excluding current transfers in Ch.2017$ (bold light green), manufacturing and trade sales in Ch.2017$ (black), consumption in Ch.2017$ (light blue), and monthly GDP in Ch.2017$ (pink), GDP (blue bars), all log normalized to 2021M11=0. Source: BLS via FRED, Federal Reserve, BEA 2025Q2 advance release, S&P Global Market Insights (nee Macroeconomic Advisers, IHS Markit) (7/1/2025 release), and author’s calculations.  The labor market really does look like it’s slowing down… Figure 2: Private nonfarm payroll employment, July release (bold black), Jun release (purple), ADP July release (green), all s.a.,  in logs, 2025M01=0. Source: BLS, ADP via FRED, and author’s calculations.        

Economic News

EPU and EPU-Trade Policy Uncertainty Measured

Through 8/3: Figure 1: EPU (blue, left scale), EPU-trade (green, right scale). Source: policyuncertainty.com.  Trade policy uncertainty, I can see why that’s risen. Economic Policy Uncertainty? Well, if you start disassembling the economic data infrastructure that underpins TIPS, Social Security COLAs, and inflation numbers necessary for private and public decision-making, maybe this is the least uncertainty you can expect.  

Economic News

Trump’s Willing Enabler

From the NYT: Two days after President Trump fired the top labor official in charge of compiling statistics on employment, Kevin Hassett, the director of the White House National Economic Council, insisted on Sunday that the administration was “absolutely not” shooting the messenger on the heels of a poor jobs report. But Mr. Hassett repeatedly declined to furnish detailed evidence that would substantiate the president’s claims that the data had been rigged or manipulated to hurt him politically. … on “Fox News Sunday,” Mr. Hassett claimed there were “partisan patterns” in the jobless data, and said that “data can’t be propaganda.” It is important to recall that Dr. Hassett both authored Dow 36,000 in 1999, and applied a quadratic specification to predict covid fatalities.

Scroll to Top