Economic News

Economic News

Final Nowcast for Q2

Atlanta Fed nowcast incorporating advance economic indicators indicates 2.9% q/q AR, up from 2.4%. The news is in final sales to private domestic purchasers. Figure 1: Final sales to private domestic purchasers (bold black), GDPNow of 7/25 (red *), GDPNow of 7/29 (light blue square), all in bn.Ch.2017$ SAAR.  Source: BEA 2025Q1 3rd release, Atlanta Fed, and author’s calculations. Since this series excludes imports and exports as well as inventories, it should be less affected by distortions associated with tariff front-running. That nowcasted final sales growth in Q2 is  0.8% SAAR, down from 0.9% just four days ago. Moreover, this Q2 growth rate is less than half the 1.9% in Q1, and 2.9% in 2024Q4. So, don’t be overly focused on GDP.

Economic News

Conference Board: Economic Confidence Up (a Little)

The Conference Board today: The Conference Board Consumer Confidence Index® improved by 2.0 points in July to 97.2 (1985=100), from 95.2 in June (revised up by 2.2 points). The Present Situation Index—based on consumers’ assessment of current business and labor market conditions—fell 1.5 points to 131.5. The Expectations Index—based on consumers’ short-term outlook for income, business, and labor market conditions—rose 4.5 points to 74.4. But expectations remained below the threshold of 80 that typically signals a recession ahead for the sixth consecutive month. The cutoff date for preliminary results was July 20, 2025. “Consumer confidence has stabilized since May, rebounding from April’s plunge, but remains below last year’s heady levels,”  … Figure 1 shows the Conference Board’s measure vs. the MIchigan measure, and a text based news sentiment index. Figure 1: University of Michigan Consumer Sentiment (blue), Conference Board Consumer Confidence (tan), and Shapiro, Sudhof and Wilson (2020) SF Daily News Sentiment Index (light green) , all demeaned and normalized by standard deviation (for the 2021-2025M02 sample period); and Shapiro, Sudhof and Wilson (2020) SF Daily News Sentiment Index (black, right scale). The News Index observation for July is through 7/27/2025. Orange shading denotes Trump 2.0 administration. Orange dashed line at “Liberation Day” in 2025M04. Source: U.Mich via FRED, Conference Board via Investing.com, SF Fed, and author’s calculations. The Conference Board measure is TWO standard deviations lower than November 2024, and ONE standard deviation below January 2025. Note the distinction between current conditions vs. expected. Source: Conference Board, accessed 7/29/2025. As CB observes, the expectations measure remains below the recession threshold. Finally, as for individual households’ views regarding their own expected situation in the future, this figure is relevant. Source: Conference Board, accessed 7/29/2025. While the “better”-“worse” differential has shifted to slightly more positive relative the nadir in April, it is substantially below the January 2025 high point.  

Economic News

Forecasts: CEA >> IMF > WSJ

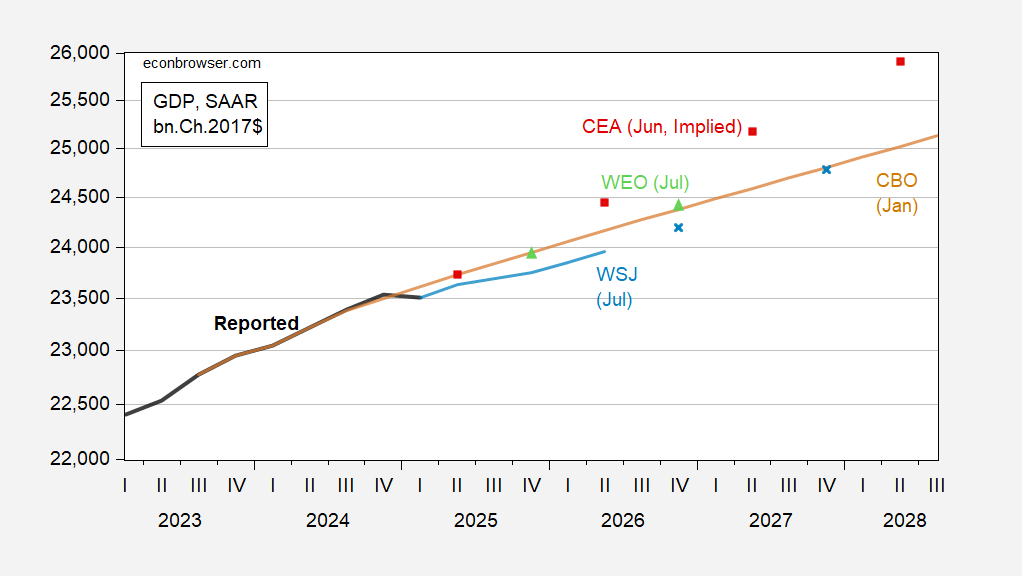
From IMF’s July World Economic Outlook, released today: Figure 1: GDP (bold black), CBO current law projection of January (tan), implied CEA forecast using CBO current law (red squares), mean forecast from July WSJ survey (light blue line, x), July WEO (light green triangle), all in bn.Ch.2017$ SAAR. Source: BEA 2025Q1 3rd release, CBO January 2025, CEA (2025), WSJ survey, and author’s calculations. The IMF WEO trajectory is based on this forecast: Source: IMF, WEO July 2025 update. From the report: Global growth is projected at 3.0 percent for 2025 and 3.1 percent in 2026. The forecast for 2025 is 0.2 percentage point higher than that in the reference forecast of the April 2025 World Economic Outlook (WEO) and 0.1 percentage point higher for 2026. This reflects stronger-than-expected front-loading in anticipation of higher tariffs; lower average effective US tariff rates than announced in April; an improvement in financial conditions, including due to a weaker US dollar; and fiscal expansion in some major jurisdictions. Global headline inflation is expected to fall to 4.2 percent in 2025 and 3.6 percent in 2026, a path similar to the one projected in April. The overall picture hides notable cross-country differences, with forecasts predicting inflation will remain above target in the United States and be more subdued in other large economies. Risks to the outlook are tilted to the downside, as they were in the April 2025 WEO. A rebound in effective tariff rates could lead to weaker growth. Elevated uncertainty could start weighing more heavily on activity, also as deadlines for additional tariffs expire without progress on substantial, permanent agreements. Geopolitical tensions could disrupt global supply chains and push commodity prices up. Larger fiscal deficits or increased risk aversion could raise long-term interest rates and tighten global financial conditions. Combined with fragmentation concerns, this could reignite volatility in financial markets. On the upside, global growth could be lifted if trade negotiations lead to a predictable framework and to a decline in tariffs. Policies need to bring confidence, predictability, and sustainability by calming tensions, preserving price and financial stability, restoring fiscal buffers, and implementing much-needed structural reforms.

Economic News

A Quasi-Real Time Measure of the Average Effective Tariff Rate

The Yale Budget Lab regularly (’cause… Trump) updates the stated effective tariff rate. But what’s the actual effective tariff rate in effect given all the threats, pauses, etc.? Not sure? Fortunately, Paweł Skrzypczyński is on the case: Source: Paweł Skrzypczyński, accessed 7/29/2025. As of June July, the average effective tariff rate is 9.1%. Note that as of today (noon CT), Yale Budget Lab indicates the average effective tariff rate given policies announced through 7/27 is 16.6% (pre-substitution, before August 1 tariffs are in effect).            

Scroll to Top