Economic News

Economic News

Conference Board: Economic Confidence Up (a Little)

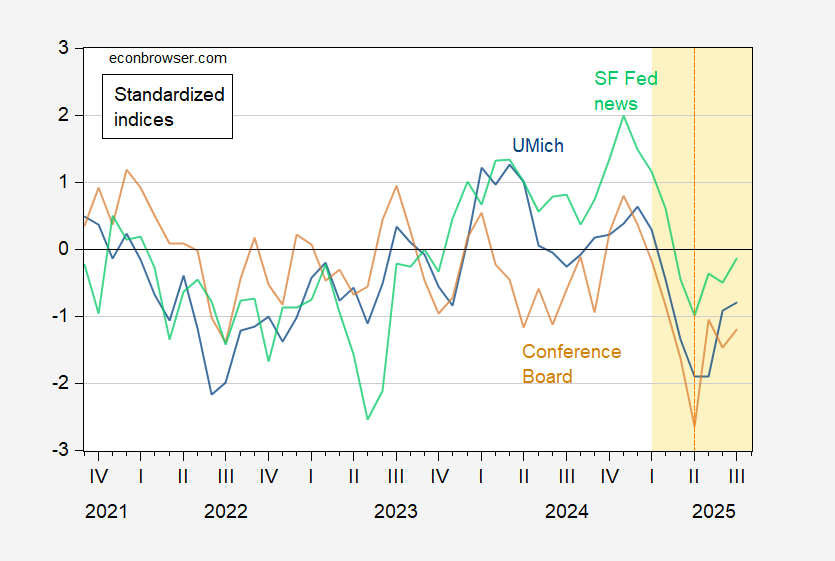
The Conference Board today: The Conference Board Consumer Confidence Index® improved by 2.0 points in July to 97.2 (1985=100), from 95.2 in June (revised up by 2.2 points). The Present Situation Index—based on consumers’ assessment of current business and labor market conditions—fell 1.5 points to 131.5. The Expectations Index—based on consumers’ short-term outlook for income, business, and labor market conditions—rose 4.5 points to 74.4. But expectations remained below the threshold of 80 that typically signals a recession ahead for the sixth consecutive month. The cutoff date for preliminary results was July 20, 2025. “Consumer confidence has stabilized since May, rebounding from April’s plunge, but remains below last year’s heady levels,”  … Figure 1 shows the Conference Board’s measure vs. the MIchigan measure, and a text based news sentiment index. Figure 1: University of Michigan Consumer Sentiment (blue), Conference Board Consumer Confidence (tan), and Shapiro, Sudhof and Wilson (2020) SF Daily News Sentiment Index (light green) , all demeaned and normalized by standard deviation (for the 2021-2025M02 sample period); and Shapiro, Sudhof and Wilson (2020) SF Daily News Sentiment Index (black, right scale). The News Index observation for July is through 7/27/2025. Orange shading denotes Trump 2.0 administration. Orange dashed line at “Liberation Day” in 2025M04. Source: U.Mich via FRED, Conference Board via Investing.com, SF Fed, and author’s calculations. The Conference Board measure is TWO standard deviations lower than November 2024, and ONE standard deviation below January 2025. Note the distinction between current conditions vs. expected. Source: Conference Board, accessed 7/29/2025. As CB observes, the expectations measure remains below the recession threshold. Finally, as for individual households’ views regarding their own expected situation in the future, this figure is relevant. Source: Conference Board, accessed 7/29/2025. While the “better”-“worse” differential has shifted to slightly more positive relative the nadir in April, it is substantially below the January 2025 high point.  

Economic News

Forecasts: CEA >> IMF > WSJ

From IMF’s July World Economic Outlook, released today: Figure 1: GDP (bold black), CBO current law projection of January (tan), implied CEA forecast using CBO current law (red squares), mean forecast from July WSJ survey (light blue line, x), July WEO (light green triangle), all in bn.Ch.2017$ SAAR. Source: BEA 2025Q1 3rd release, CBO January 2025, CEA (2025), WSJ survey, and author’s calculations. The IMF WEO trajectory is based on this forecast: Source: IMF, WEO July 2025 update. From the report: Global growth is projected at 3.0 percent for 2025 and 3.1 percent in 2026. The forecast for 2025 is 0.2 percentage point higher than that in the reference forecast of the April 2025 World Economic Outlook (WEO) and 0.1 percentage point higher for 2026. This reflects stronger-than-expected front-loading in anticipation of higher tariffs; lower average effective US tariff rates than announced in April; an improvement in financial conditions, including due to a weaker US dollar; and fiscal expansion in some major jurisdictions. Global headline inflation is expected to fall to 4.2 percent in 2025 and 3.6 percent in 2026, a path similar to the one projected in April. The overall picture hides notable cross-country differences, with forecasts predicting inflation will remain above target in the United States and be more subdued in other large economies. Risks to the outlook are tilted to the downside, as they were in the April 2025 WEO. A rebound in effective tariff rates could lead to weaker growth. Elevated uncertainty could start weighing more heavily on activity, also as deadlines for additional tariffs expire without progress on substantial, permanent agreements. Geopolitical tensions could disrupt global supply chains and push commodity prices up. Larger fiscal deficits or increased risk aversion could raise long-term interest rates and tighten global financial conditions. Combined with fragmentation concerns, this could reignite volatility in financial markets. On the upside, global growth could be lifted if trade negotiations lead to a predictable framework and to a decline in tariffs. Policies need to bring confidence, predictability, and sustainability by calming tensions, preserving price and financial stability, restoring fiscal buffers, and implementing much-needed structural reforms.

Economic News

A Quasi-Real Time Measure of the Average Effective Tariff Rate

The Yale Budget Lab regularly (’cause… Trump) updates the stated effective tariff rate. But what’s the actual effective tariff rate in effect given all the threats, pauses, etc.? Not sure? Fortunately, Paweł Skrzypczyński is on the case: Source: Paweł Skrzypczyński, accessed 7/29/2025. As of June July, the average effective tariff rate is 9.1%. Note that as of today (noon CT), Yale Budget Lab indicates the average effective tariff rate given policies announced through 7/27 is 16.6% (pre-substitution, before August 1 tariffs are in effect).            

Economic News

What Happens If IEEPA Tariffs Are Rule Illegal?

Oral arguments before the appellate court take place this week. Suppose the tariffs invoked under IEEPA are struck down, then that decision would likely be appealed to the Supreme Court (eventually). From CNBC: The case, known as V.O.S. Selections v. Trump, is the furthest along of more than half a dozen federal lawsuits challenging Trump’s use of the emergency-powers law. It’s set for oral argument before the Federal Circuit on Thursday morning. “I think the tariffs are at risk,” said Ted Murphy, partner and head of global trade practice at law firm Sidley Austin, in an interview with CNBC. The law has “never been used for this purpose,” and it’s “being used quite broadly,” Murphy said. “So I think there are legitimate questions.” What about at the Supreme Court? The article continues: “Trump will probably continue to lose in the lower courts, and we believe the Supreme Court is highly unlikely to rule in his favor,” U.S. policy analysts from Piper Sandler wrote in a research note Friday morning. The analysts wrote that such a loss would effectively mean the collapse of almost every trade development that Trump has held up as an accomplishment during his first six months in office. “If the Supreme Court rules against Trump, all of the trade deals Trump has reached in recent weeks — and those he will reach in the coming days — are illegal,” the analysts wrote. “So are his letters informing countries of their new tariffs, the current 10% minimum, and the reciprocal tariffs he has proposed or threatened,” they added. If the analyst is correct, then the question would be whether Mr. Trump complies. Abolishing the tariffs would then mean a massive hit on the US and global economy would have been for naught, while elevating policy uncertainty to capital investment-reducing levels. (Of course, better to get rid of the tariffs than to keep them.) Figure 1: Top Panel: EPU-Trade, Bottom Panel: EPU. NBER defined peak-to-trough recession dates shaded gray. Source: policyuncertainty.com, Iacoviello, NBER.  More on the cases from the CRS. By the way, I’m not certain what “national emergency” we’re in. GDP, core GDP are growing, inflation is for the moment below 3% (albeit accelerating), unemployment is at 4.1%.

Economic News

Gerard Baker: “If Trump’s Tariffs Are So Bad, Where’s the Recession?”

That question was posed in the WSJ, and poses three possible answers: There are three possible answers: First, it’s too early to tell. Most of the tariffs announced haven’t been in place long. … Which leads us to the second possibility—the tariffs thus far have just not been big enough to cause the harm economists warned us about from full-on protectionism. The U.S. is a relatively closed economy … So third, and tantalizingly, perhaps the conventional wisdom is wrong. Or, more precisely, since no one can deny the effect of taxes are real, perhaps, in their rush to emphasize the negatives, economists have overlooked the countervailing forces at work with tariffs: The redistribution of the burden of duties between foreign exporters, U.S. importers and consumers may be reordering the balance of benefit between domestic and foreign businesses and between companies and consumers. Federal tariff revenue up to $300 billion a year will produce gains for Americans. On count 1, I’d remark that most of the tariffs haven’t into play yet. See the effective tariff rate as calculated by the Budget Lab. Source: Budget Lab, accessed 7/28/2025. Baker also doesn’t mention the buffering effect of pre-tariff inventory accumulation, which is strange as most of the economics commentary mentions this factor. On the second point, it’s true the US economy is relatively closed as compared to say UK, or Singapore in an extreme example. But it’s more open than it was just 50 years ago, and more of the trade is of differentiated goods, included in value chains. That magnifies the impact of tariffs. So I think when the tariffs are actually in place, we will see effects (although with USMCA exemptions still in place, we won’t have it as bad as it could be). The third point is one where Baker is trying to channel the optimal tariff theory. There is a tariff rate that — given the elasticities — maximizes welfare for the country imposing tariffs. But in general such tariff rates are not typically 10-15%, since the US is not a large economy in the context of other countries’ exports. Moreover, empirically, in the 2018 trade war, prices did not behave in a way consistent with this thesis. Most of the burden was borne by US consumers (broadly defined as domestic households, firms, workers). See pp. 133-34 in  Chinn and Irwin, International Economics (CUP, 2025).

Economic News

Stay Tuned: World Trade for June

From CPB, data through May: Figure 1: World Trade Volume (blue), World Industrial Production (tan), both 2006=100., on log scale. Light orange shading denotes Trump 2.0 administration. Orange dashed line at “Liberation Day”. Source: Central Plaanbureau. There’s a drop in May as tariff-front running ended. We need June’s data for some clarity.i When (Trump) Tariffs last bloomed: Figure 2: World Trade Volume (blue), World Industrial Production (tan), both 2006=100., on log scale. Light orange shading denotes Trump 1.0 administration. Orange dashed line at notice of intent to impose Section 232, 301 tariffs. Source: Central Plaanbureau. By the way, as everybody is hailing the “deal” with Europe (All those investments! All those purchases of energy products!), just remember the sorry implementation record of the Trump US-China Economic and Trade agreement, Phase 1. US exports are shown in this post, for Q1, and nowcast for Q2.

Economic News

Wegovy ™ for Me, but Not for Thee (cont’d)

The just-announced trade “deal” (what’s the enforcement mechanism?) apparently covers pharmaceuticals. Where do we get most of our pharma (by value)? From Joey Politano, the answer: Source: Politano.  I don’t think there’s anything on paper (and even if there were, would it mean much?). So, not the 50% I pondered back in May, but still 15% is above 10%. * To be clear, we do not know if Mr. Trump is taking a GLP-1. ** Back of the envelope calculation of tax increase. Effective tariff rate rises from 1.2% to 15%; 2024 imports from EU equals approx 600 bn. Assuming no price response (price elasticity is 0), and US as small country, this is a tax increase of $83bn/year, or $70 bn/year assuming a price elasticity of demand of unity.

Economic News

US Real Exports Flatlining Despite Rising RoW GDP, Depreciated Dollar

What else did you expect? Figure 1: US exports of goods and services (black, left log scale), GDPNow nowcast (light blue square, left log scale), both in bn.Ch.2017$ SAAR; export weighted rest-of-world GDP, 2005=100 (red, right scale). NBER defined peak-to-trough recession dates shaded gray. Source: BEA 2025Q1 3rd release, Atlanta Fed, Dallas Fed, NBER and author’s calculations. So in Q1, RoW GDP rose but real US exports fell; more telling, the dollar depreciated in inflation adjusted term from January to March, which would have in normal times induced an increase in exports…(dollar depreciation January to June is 6.5% in log terms). The Atlanta Fed’s 7/25 nowcast indicates 3.3% q/q annualized (0.9% q/q) decline in Q2 real exports (incorporates monthly trade data through May’s numbers).

Scroll to Top