
Chair Warsh’s focus on the Fed’s balance sheet and inflation can be interpreted in many ways. One way is a money base version of the Quantity Theory.
Take the Quantity Theory as an identity:
MV = PQ
P = MV/Q
Let M = MB × mult, where M is a broad measure of money, MB is the money base, roughly the liabilities side of the Fed’s balance sheet. Take logs, where lower case letters denote logs of upper case letters.
p = mb + log(mult) + v – q
One can think of q as a determinant of money demand, usually GDP, but could be “total transactions”. Omitting v, here’s a graph of the price level and money base to GDP:
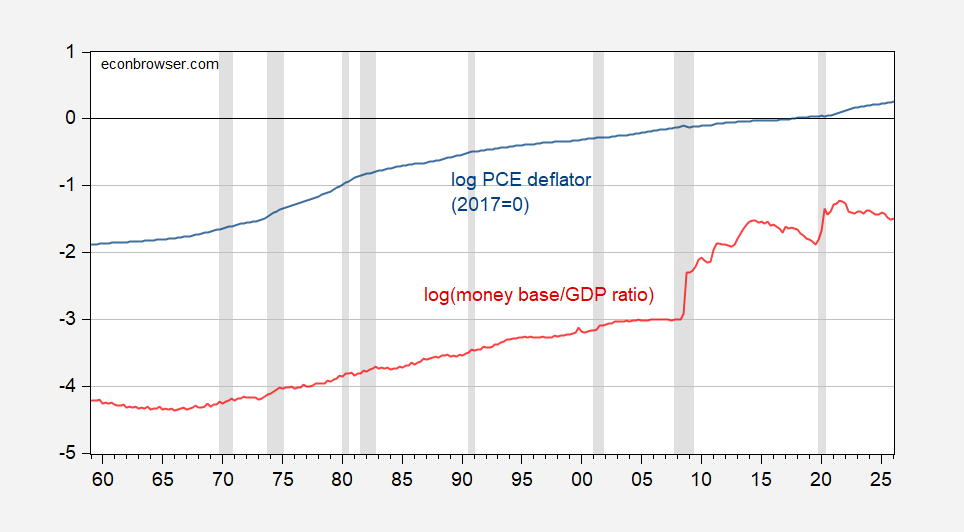
Not an obvious empirical relationship.
Take the first difference. If velocity and money multiplier are constant, then:
π = Δmb – Δq
Maybe there’re short run and long run relationships implied by money base quantity theory (if I can coin a phrase). Then I estimate an error correction model imposing a 1:1 cointegrating relationship between money base and GDP, over the 1959-2019 period (so, ending before the pandemic-associated round of quantitative/credit easing).
πt = 0.000 -0.003mbt – 0.003 Δq – 0.0005(mbt-1–qt-1 ) + 0.008Δmbt-1 + 0.016Δqt-1 + 0.825πt-1
Adj-R2 = 0.73, SER = 0.0033, DW = 2.21, NObs = 242, bold denotes significance at 10% msl using robust standard errors. Differences above are not annualized.
Note that the error correction term’s coefficient is -0.0005, and is statistically significant at the 5% msl. That means there is long run reversion to 1:1 MB-GDP relationship. However, the rate of reversion implies a half-life of a deviation of about 115 years…
The dynamic out-of-sample ex post forecast (aka historical simulation) shows that inflation is barely tracked.
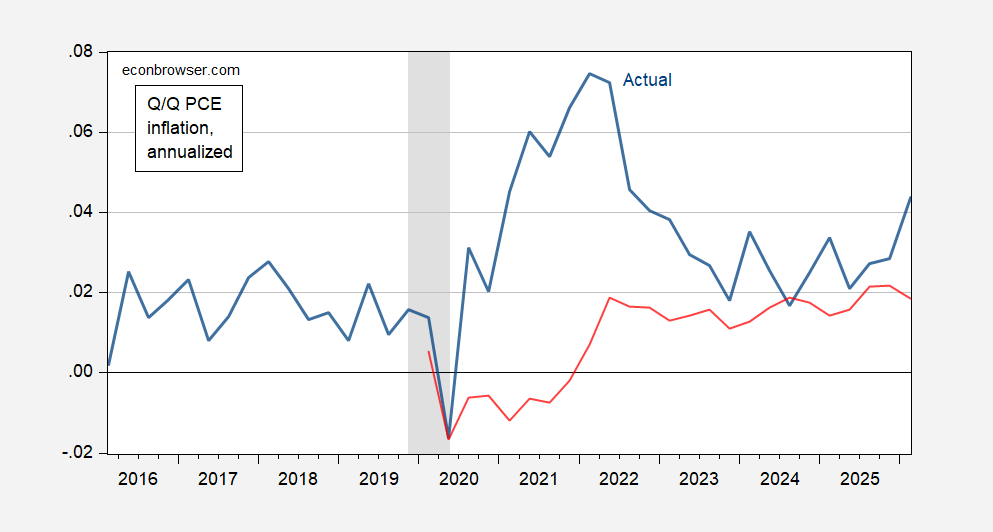
Figure 1: Q/Q annualized PCE inflation (blue), ex post simulation (red). NBER defined peak-to-trough recession dates shaded gray. Source: BEA, NBER, and author’s calculations.
There’s probably a specification that produces “better” predictions, but i don’t think there is one that does a lot better. That’s because the specification above, taking away the lagged inflation rate, has only a 12% adjusted R2.
By the way, if one wanted to take a pure growth rates view, so omitting the cointegrating relationship, it turns out that one can reject the null hypothesis of no Granger causality running from PCE inflation to the money base/GDP ratio growth rate, but one cannot reject the null hypothesis of no Granger causality running from money base/GDP growth rate to PCE inflation (using the 5% msl). This is true regardless of whether the shorter sample (1959-2019) or full sample (1959-2026Q1) is used.